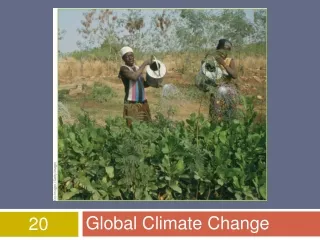
Global climate change
8. Global climate change. Weather and climate. Weather = local physical properties of the troposphere, including temperature, pressure, humidity, cloudiness, wind Climate = pattern of atmospheric conditions across large geographic regions over long periods of time (seasons, years, millennia)

Global climate change
E N D
Presentation Transcript
8 Global climate change
Weather and climate Weather = local physical properties of the troposphere, including temperature, pressure, humidity, cloudiness, wind Climate = pattern of atmospheric conditions across large geographic regions over long periods of time (seasons, years, millennia) “Climate is what we expect; weather is what we get.” –Mark Twain
Radiation, atmosphere, and temperature Figure 12.1
Studying climate change: Direct sampling • Scientists have recorded carbon dioxide levels in the atmosphere directly since 1958 • Went from 315 to 373 ppm. • (The up and down zigzags are from regular winter-summer fluctuations.) Figure 12.6
Carbon dioxide increase Due to: Burning of fossil fuels: We remove carbon-rich fuels from the ground where they have been stored for millions of years, and combust them in an instant, sending CO2 into the atmosphere. Deforestation: Cutting down trees, removing vegetation from the land, decreases the sink for carbon. Some of the C in plants becomes CO2 sent into the atmosphere.
Earth’s Orbit Variation of Earth’s tilt • These 3 types of cycles also affect climate in the long term. Variation of Earth’s orbit Wobble of Earth’s axis Figure 12.3
El Niño and La Niña • The best-known interactions between oceans and climate are El Niño and La Niña events. • In normal conditions, winds push warm waters (red) to the western Pacific Ocean. From The Science behind the Stories
El Niño and La Niña Normal conditions • In an El Niño event, winds weaken, warm water sloshes to the east, and prevents the cold upwelling. • La Niña is the opposite: Cold water spreads west. From The Science behind the Stories
El Niño and La Niña • El Niño and La Niña events influence rainfall and temperature globally, especially on each side of the Pacific. • They cause droughts, floods, etc.
Studying climate change • How do scientists know all these things about what climate was like in the past, before we were here? • A number of methods have been developed…
Studying climate change: Ice cores • They contain bubbles of gas preserved from the time when each layer formed. Figure 12.5
Studying climate change: Pollen analysis • Scientists also drill cores into the sediments of ancient lake beds. From The Science behind the Stories
Climate change and the IPCC report • In 2001, the world’s climate scientists combined to produce the single most comprehensive and authoritative research summary on climate change: • The Third Assessment Report • of the • Intergovernmental Panel on Climate Change (IPCC) • The IPCC report summarized all scientific data on climate change, future predictions, and possible impacts.
Climate change and the IPCC report • First, the IPCC report established that global temperature is rising. • Direct measurements from thermometers since 1860 demonstrate this. Figure 12.9a
Climate change and the IPCC report • Proxy indicators of temperature (from pollen, ice cores, etc.) were reviewed to establish ancient temperatures. • These data (BLUE) overlapped with the direct temperature measurements (RED). (Gray shows statistical uncertainty.) Figure 12.9b
The IPCC report • Some key findings on temperature: • • Average temperature rose 1.0°F during the 20th century • • 1990s = warmest decade in past 1,000 years • • Northern hemisphere increase in 1900s = most in 1,000 years • • Droughts increased in frequency and severity • • Precipitation increased in north, but varied elsewhere
The IPCC report • The IPCC also reported findings on physical changes: • • Average sea level increased 4–8 inches during 20th century • • 2 weeks less ice cover on northern lakes and rivers • • Arctic sea ice thinned 10–40% in recent decades • • Mountain glaciers melted back worldwide • • Snow cover decreased 10% since satellite observations began • • Growing season lengthened 1–4 days each decade over the past 40 years
The IPCC report • Biological changes were also found by the IPCC: • • Geographic ranges of many species have shifted toward the poles and up in elevation. • • In spring, plants are flowering earlier, birds migrating earlier, animals breeding earlier, and insects emerging earlier. • • Coral reefs are “bleaching” more frequently due to ocean acidity.
The IPCC report: Causes of climate change The IPCC report reflected the predominant view of climate scientists: Human activities (especially fossil fuel use leading to rising greenhouse gas levels) are the main cause of climate change. However, the ways anthropogenic factors and natural factors interact is complex and not fully understood, so predicting the future is uncertain.
Climate change predictions: Impacts • The IPCC and other groups have predicted future impacts of climate change. Predictions for the U.S. include: • • Temperature will rise 5–9°F. • • Droughts, floods, snowpack will decline, and water shortages will create diverse problems. • • Temperature extremes will cause health problems; tropical diseases will move north into the U.S. • • Sea level rise will flood coastal wetlands, real estate. • • Ecosystems will be altered; some will disappear.
Sea level rise • Just as sea level rise could devastate the Maldives… • … it could also inflict damage on the U.S.’s coastal economies and ecosystems. • A 20-inch sea level rise would flood wetlands and drylands on all U.S. coasts. Figure 12.21
All areas of the U.S. coast would suffer erosion. Predicted U.S. impacts: Sea level rises Figure 12.11b,c
Central Case: Rising temperatures and seas may take the Maldives • 80% of this island nation’s land is <1 m above water. • Globally warming temperatures are causing sea levels to rise worldwide, endangering many island nations. • They beg the U.S. and others to reduce fossil fuel use.
Predicted U.S. impacts: Heat index rises • Two models show big increases in July heat index for the next 100 years, especially in the central and southeast U.S. • (Heat index combines temperature and humidity.) Figure 12.13a
Debate over climate change • Virtually all climate researchers agree that global climate is changing. • Virtually all climate researchers agree that human fossil fuel use plays a large role in driving climate change. • There is uncertainty over other possible factors that may be involved, and how they might interact with anthropogenic causes.
Emissions reduction: More efficient generation and usage • Electricity generation is the biggest source of greenhouse gas emissions in the U.S. • So solutions include: • • Improved technology at plants • • Cleaner-burning coal • • Energy conservation by consumers Figure 12.15
Debate over climate change • There is much debate over what to do about climate change. • • Would costs of reducing greenhouse gas emissions outweigh costs of climate change? • • Should industrialized nations bear more responsibility for reducing emissions, or should all nations share equally? • • Should emissions reduction occur voluntarily, or through legal, political, or economic pressure?