Download
1 / 31
310 likes | 514 Views
TROPOSPHERIC OZONE AS A CLIMATE GAS, AND SATELLITE OBSERVATIONS OF ITS PRECURSORS. Daniel J. Jacob. CHEMISTRY, AEROSOLS, AND CLIMATE: TROPOSPHERIC UNIFIED SIMULATION (CACTUS). A NASA Interdisciplinary Science (IDS) investigation:

E N D
TROPOSPHERIC OZONE AS A CLIMATE GAS, AND SATELLITE OBSERVATIONS OF ITS PRECURSORS Daniel J. Jacob
CHEMISTRY, AEROSOLS, AND CLIMATE:TROPOSPHERIC UNIFIED SIMULATION (CACTUS) A NASA Interdisciplinary Science (IDS) investigation: Harvard (Jacob, P.I.), Caltech (Seinfeld), NASA/GISS (Rind), UC Irvine (Prather) CACTUS model Atmospheric chemistry • emissions • land use • climate forcing GISS GCM Aerosol microphysics “…Kyoto also failed to address two major pollutants that have an impact on warming: black soot and tropospheric ozone. Both are proven health hazards. Reducing both would not only address climate change, but also dramatically improve people's health.” (George W. Bush, June 11 2001 Rose Garden speech) D climate • chemistry
GLOBAL BUDGET OF TROPOSPHERIC OZONE Global sources and sinks, Tg O3 yr-1 (GEOS-CHEM model) O2 hn O3 STRATOSPHERE 8-18 km TROPOSPHERE hn NO2 NO O3 hn, H2O OH HO2 H2O2 Deposition CO, CH4, VOC
Lifetime is ~ weeks GLOBAL DISTRIBUTION OF TROPOSPHERIC OZONE Climatology of observed ozone at 400 hPa in July from ozonesondes and MOZAIC aircraft (circles) and corresponding GEOS-CHEM model results for 1997 (contours). GEOS-CHEM tropospheric ozone columns for July 1997 Li et al. [2001]
ANTHROPOGENIC INCREASE IN TROPOSPHERIC OZONE DRIVEN BY NOx AND METHANE EMISSIONS PRESENT-DAYEMISSIONS NOx (Tg N yr-1) METHANE (Tg C yr-1) BIOMASS BURNING 20 STRATOSPHERE 0.2 LIGHTNING 5.8 ANIMALS 90 WETLANDS 180 SOILS 5.1 LANDFILLS 50 GAS 60 BIOMASS BURNING 5.2 FOSSIL FUEL 23.1 COAL 40 AIRCRAFT 0.5 RICE 85 TERMITES 25 BIOFUEL 2.2
RISE IN TROPOSPHERIC OZONE OVER 20th CENTURY Preindustrial ozone models } Observations at mountain sites in Europe [Marenco et al., 1994]
RADIATIVE FORCING FROM TROPOSPHERIC OZONE Annual mean values (0.49 W m-2 globally) (9.6 mm) Global radiative forcing DF (W m-2) But how good is radiative forcing as an indicator of climate change, when this forcing is so heterogeneous?
equilibrium climate DT = 0.3oC GISS GCM ANALYSIS OF CLIMATE RESPONSE TO TROPOSPHERIC OZONE CHANGE OVER 20th CENTURY GCM equilibrium simulation for present-day climate with present vs. preindustrial tropospheric ozone; includes “Q-flux” ocean Also sensitivity simulations with DO3 = 18 ppb, DCO2 = 25 ppm, giving same DF DF = 0.49 W m-2 present-day ozone Preindustrial ozone L.J. Mickley, Harvard
INHOMOGENEITY OF CLIMATE RESPONSE TO OZONE CHANGE OVER 20th CENTURY • Greater warming in northern hemisphere • Strong cooling in stratosphere: Stratospheric ozone Tropospheric ozone 9.6 mm Surface L.J. Mickley, Harvard
LOWER STRATOSPHERIC COOLING FROM TROPOSPHERIC OZONE IS STRONGEST IN ARCTIC WINTER particularly sensitive region for recovery of ozone layer! GCM temperature change in lower stratosphere in DJF (oC) from increasing tropospheric ozone over 20th century L.J. Mickley, Harvard
CLIMATE RESPONSE EXPERIMENTS WITH IDENTICAL GLOBAL RADIATIVE FORCINGS (0.49 W m-2) FROM: • D tropospheric ozone • D uniform tropospheric ozone (18 ppv) • D carbon dioxide (25 ppmv) • CO2 is a more effective warming agent at surface • In lower stratosphere, CO2 causes warming while tropospheric ozone causes cooling L.J. Mickley, Harvard
WHY IS CO2 MORE EFFECTIVE THAN OZONE FOR SURFACE WARMING AT SAME RADIATIVE FORCING? Correlation of forcing with 500 hPa humidity in tropics (25N-25S) Ozone CO2 DFCO2 – DFO3 Overlap of CO2 and H2O bands causes CO2 forcing to shift poleward where ice feedback enhances warming L.J. Mickley, Harvard
GCM SURFACE WARMING PATTERNS (oC) FROM INCREASING TROPOSPHERIC OZONE OVER 20th CENTURY – JJA SURFACE Equivalent uniform CO2 Tropospheric ozone Difference (white = insignificant or high altitude) Largest warmings downwind of ozone source regions – ozone there is more effective than CO2 L.J. Mickley, Harvard
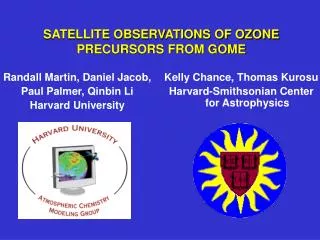
USING SATELLITE MEASUREMENTS OF NO2 AND HCHO COLUMNS (SOLAR BACKSCATTER) TO MAP NOx AND VOC EMISSIONS GOME satellite instrument Tropospheric NO2 column ~ ENOx Tropospheric HCHO column ~ EVOC ~ 2 km hn (420 nm) BOUNDARY LAYER hn (340 nm) NO2 NO HCHO CO OH hours O3, RO2 hours VOC 1 day HNO3 Emission Deposition Emission NITROGEN OXIDES (NOx) VOLATILE ORGANIC CARBON (VOC)
IN SCATTERING ATMOSPHERE, THE AIR MASS FACTOR (AMF) OF A SOLAR BACKSCATTER MEASUREMENT DEPENDS ON VERTICAL DISTRIBUTION OF THE GAS Illustrative retrieval of HCHO column at 340 nm Instrument sensitivity w(s) (“scattering weight”) geometric what GOME sees Vertical shape factor S(s) (normalized mixing ratio) AMFG = 2.08 actual AMF = 0.71 Palmer et al. [2001]
USE GLOBAL 3-D MODEL DRIVEN BY ASSIMILATED METEOROLOGICAL DATA TO PROVIDE AMFs FOR EVERY SATELLITE VIEWING SCENE GEOS-CHEM GLOBAL 3-D MODEL OF TROPOSPHERIC CHEMISTRY: provides S(s) LIDORT RAD.TRANSFER MODEL: provides w(s) AMF spectral fit SATELLITE DATA SLANT COLUMN VERTICAL COLUMN • Best information applied to each scene • Consistency in comparing model and observed columns • Apply with any 3-D model (recalculate AMFs using tabulated scattering weights) ADVANTAGES OF 3-D MODEL APPROACH FOR COMPUTING AMFs
HCHO COLUMNS FROM GOME OVER U.S.:July 1996 means Palmer et al. [2001] BIOGENIC ISOPRENE IS THE MAIN SOURCE OF HCHO IN U.S. IN SUMMER GEIA isoprene emissions GOME slant GEOS-CHEM vertical R = 0.83 Bias 14% Precision: 4x1015 cm-2 GOME vertical Difference
MAPPING OF ISOPRENE EMISSIONS FOR JULY 1996 BY SCALING OF GOME FORMALDEHYDE COLUMNS [Palmer et al., 2002] GOME COMPARE TO… GEIA (IGAC inventory) BEIS2 (official EPA inventory)
SEASONAL VARIABILITY OF HCHO COLUMNS (9/96-8/97)- proxy for isoprene emissions - Dorian Abbott (Harvard) GOME GEOS-CHEM GOME GEOS-CHEM MAR JUL APR AUG SEP MAY JUN OCT
GOME Tropospheric NO2 GEOS-CHEM Tropospheric NO2 with a priori emissions (scaled GEIA) r = 0.75 bias=5% DJF 96-97 MAM 1997 JJA 1997 SON 1996 R.V. Martin 1015 molecules cm-2
OPTIMIZED NOx EMISSION INVENTORY FROM GOME R.V. Martin, Harvard A PRIORI A POSTERIORI
TRACE-P AIRCRAFT MISSION (March-April 2001):top-down constraints on Asian emissions Jacob et al. [2002] CO aircraft observations (G.W. Sachse) MOPITT CO Observations (IR emission) Chemical forecasts CTMs Daily CO biomass burning emissions from AVHRR (C.L. Heald, Harvard) CO fossil and biofuel bottom-up emissions (D.R. Streets, ANL)
MOPITT VALIDATION PROFILES DURING TRACE-P Aircraft w/ MOPITT av kernels MOPITT aircraft Averaging kernels
MEAN MOPITT CO COLUMN DATA DURING TRACE-P (Mar-Apr 2001) MOPITT GEOS- CHEM model w/av kernels C.L. Heald, Harvard Difference
TROPOSPHERIC EMISSION SPECTROMETER (TES) • FTIR spectrometer (3.3 - 15.4 mm) to be launched on Aura satellite in 2004 (P.I. Reinhard Beer, JPL) • Field of view: 0.5x8 km2
TES NADIR RETRIEVAL OF CO About 3 pieces of information on vertical profile: ~ 1 more than MOPITT Averaging kernels CO retrieval “True” profile (GEOS-CHEM) a priori retrieved D.B. Jones, Harvard
WILLTES NADIR CO OBSERVATIONS IMPROVEOUR ABILITY TO QUANTIFY REGIONAL CO EMISSIONS? Assume that we know the true sources of CO 1 day GEOS-CHEM CO data (March 10, 2001) along TES orbit at 500 hPa From these sources of CO. Use GEOS-CHEM model to simulate “true” CO concentration field Sample model along TES orbit tracks, apply TES averaging kernels and noise to simulate retrieval of this CO field Obtain a posteriori sources and errors; How successful are we at finding the true source and reducing the error? Make a priori (deliberately wrong) estimate of CO sources by applying errors to the “true” source Apply optimal estimation inverse method
CONSTRUCTING THE MODEL ERROR COVARIANCE MATRIX USING TRACE-P OBSERVATIONS AND FORECASTS • Assume that difference between successive GEOS-CHEM CO forecasts during TRACE-P (to+48h and to + 24 h) describes the covariant error structure (“NMC method”) • Assume that mean bias in GEOS-CHEM model simulation of CO in TRACE-P is due to emission errors, and that residual relative error (RRE) is due to transport; use RRE to scale covariant error structure. • Add representativeness error of 5% (small) based on subgrid variablity in TRACE-P aircraft data Forecast error (blue) and scaled model transport error (red) GEOS-CHEM error, TRACE-P simulation CO TRACE-P data D.B. Jones and P. I. Palmer, Harvard
MODEL TRANSPORT ERRORS(DIAGONALS OF ERROR COVARIANCE MATRIX) 850 hPa, March-April 2001 RELATIVE ERROR D.B. Jones, Harvard
REGIONAL CO SOURCES TO BE RETRIEVED IN TES SIMULATION EXERCISE EUFF NAFF ASFF ASBB AFBB CHEM SABB RWFF RWBB • FF = Fossil Fuel + Biofuel • All sources include contributions from oxidation of VOCs; assume 50% error • OH is specified • Use a “tagged CO” method to estimate contribution from each source (Jacobian matrix) • Use linear inverse method to solve for annually-averaged emissions “True” Emissions (Tg/yr) NAFF: 121.3 SABB: 96.5 EUFF: 131.1 RWBB: 98.0 ASFF: 258.3 RWFF: 149.8 ASBB: 96.0 CHEM: 1125.0 AFBB: 193.9 Total = 2270 Tg/yr D. B. Jones, Harvard
INVERSION RESULTS (5 days of TES data, Mar 10-15 2001) a priori a posteriori true • With Gaussian unbiased error statistics, TES is extremely powerful for constraining global sources of CO (because it provides lots of data!) • Still very powerful when using only data above 500 hPa • Realization of this potential rests on quantification of error statistics, particularly for the model transport error – a very difficult problem! D. B. Jones, Harvard