Download
1 / 34
350 likes | 549 Views
Forest Mensuration II. Special Lecture Stand Structural Diversity. Species richness Evenness. Structure. Biological Diversity. Genetic diversity Stand level diversity ( ) Local landscape diversity ( ) Regional diversity ( ). Objectives. Concepts

E N D
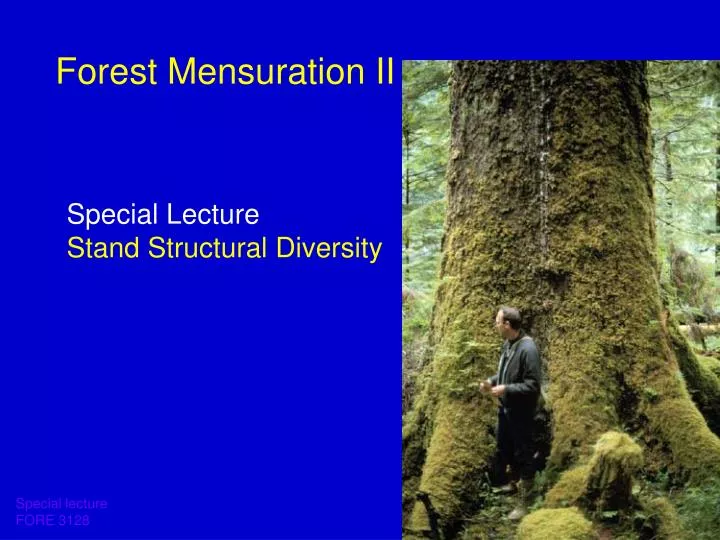
Forest Mensuration II Special LectureStand Structural Diversity
Species richness Evenness Structure Biological Diversity • Genetic diversity • Stand level diversity () • Local landscape diversity () • Regional diversity ()
Objectives • Concepts • Classification of stand structure • Measures of stand structural diversity
Stand structure attributes • Living trees • Snags, CWD • Age • Composition
Stand structure • Arrangement of trees in space • Vertical • horizontal Stand structural diversity-Variability among trees vertically and horizontally within a stand
Why stand structural diversity? • Ecological • A measure of biodiversity • Wildlife habitat • Ecosystem process (e.g., productivity) • Social • Visual quality • Management - structure based
Frequency (stems/ha) Vertical structure Single-storied/ normal Multi-storied/ irregular Multi-storied/ inverse J Two-storied/ bimodal Smith et al. 1997
Measures of vertical structural diversity • Shannon-Weiner index (H´) • Variance of tree size (S2)
Example P2 P1 P3 H’ Stand A 0.9 0.1 0.33 Stand B 0.5 0.5 0.69 Stand C 0.33 0.33 0.34 Shannon-Weiner index (H´) 1.10
Frequency (stems/ha) Proportion (Freq.) DBH Proportion (BA) DBH Shannon-Weiner index (H´)
Frequency (stems/ha) Frequency DBH Variance of tree size
Horizontal structure Stand 2 Stand 3 Stand 1 Random Clumped (aggregate) Uniform
Clark and Evans’ test (C) Measure of horizontal structure
Observed mean distance = (1.5+1.8+1.5+,,,)/15 = 1.493 m
m m Expected mean distance Random (Poisson) distribution Standard error
Clumped Random Regular 0 -1.96 1.96 C Clark and Evans’ test
z z x x y y Structural complexity index (SCI)
Problem with SCI Stand 2 Stand 3 Stand 1 Tree heights = 20 m Tree heights = 5 m Tree heights = 10 m
Summary • Concepts • Classification of stand structure • Vertical • Horizontal • Measures of stand structural diversity • Vertical • Shannon-Weiner index • Variance of tree size • Horizontal: Clark and Evans test • Three-dimensional: SCI
Possible research topics • Does increasing structural diversity affect Stand productivity? Silvicultural feasibility?
Criteria for Sustainable Forest Management • Conserving Biological Diversity • Maintenance and enhancement of Forest Ecosystem Condition and Productivity • Conservation of Soil and Water Resources • Forest Ecosystem Contributions to Globe Ecological Cycles • Multiple Benefits to Society • Accepting Society’s Responsibility for Sustainable Development