Download
1 / 19
190 likes | 334 Views
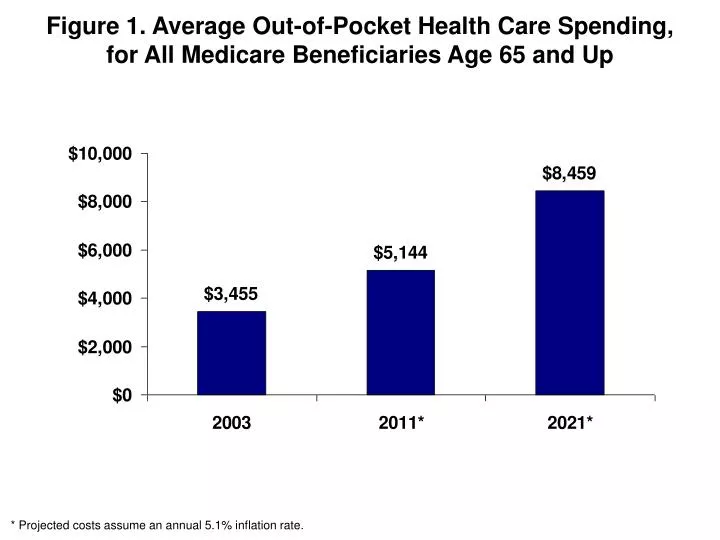
Figure 1. Average Out-of-Pocket Health Care Spending, for All Medicare Beneficiaries Age 65 and Up. * Projected costs assume an annual 5.1% inflation rate. Figure 2. Average Annual Supplemental Medigap Plan F Premium for Medicare Beneficiaries Age 65 and Up.

E N D
Figure 1. Average Out-of-Pocket Health Care Spending, for All Medicare Beneficiaries Age 65 and Up * Projected costs assume an annual 5.1% inflation rate.
Figure 2. Average Annual Supplemental Medigap Plan F Premium for Medicare Beneficiaries Age 65 and Up * Projected costs assume an annual 5.1% inflation rate.
Figure 3. Medicare Beneficiaries Without Supplemental Coverage, 2002 Percentage by annual household income Allbeneficiaries <$10,000 $10,001–$20,000 $20,001–$40,000 >$40,000
Figure 4a. Average Out-of-Pocket Health Care Spendingin 2003, for Poor and Middle-Income Individuals Percent of Federal Poverty Level
Figure 4b. Average Out-of-Pocket Health CareSpending as a Percentage of Income in 2003,for Poor and Middle-Income Individuals Percent of Federal Poverty Level
Figure 5. How Projected Account Holdings at Age 65Vary for Poor- and Middle-Income Individuals Percent of Federal Poverty Level
Figure 6. Pretax Account ContributionsWith and Without Low-Income Subsidy Accumulated under 5- and 15-year investment scenarios * 50% annual subsidization level ** 25% annual subsidization level.
Figure 7. Prefunded Account Holdings vs.Annual Medical Costs in 2021, by Income Level
Figure 8. Account Holdings vs. Costs: The Difference Between Accounts Opened at Age 50 and at Age 60 For individuals with incomes between 150% and 199% of FPL and at 1 percent investment level
Figure 9a. Participation in IRA or 401(k)-Type Plans,by Income Quintile Percentage of individuals ages 55 to 64 in 2004 Source: Survey of Income and Program Participation Study (2004, Wave 1).
Figure 9b. Participation in IRA or 401(k)-Type PlansRelative to Poverty Level Percentage of individuals ages 55 to 69 in 2000 Percent of Federal Poverty Level Source: Health and Retirement Study, 2000.
Figure 10a. Average Retirement Account Holdingsfor Individuals Ages 55 to 69, by Income Quintile, 2004 Percentage of individuals with no holdings Source: Survey of Income and Program Participation Study (2004, Wave 1).
Figure 10b. Estimated Average Retirement Account Holdingsfor Individuals Ages 55 to 69, by Income Quintile Source: Authors’ tabulation based on the Survey of Income and Program Participation Study (2004, Wave 1), the 2000 Health and Retirement Study, and Johnson, Burman, Kobes (2004).
Figure A-1. Projected Holdings at Age 65by Percentage of FPL and Under Alternative Assumptions
Figure B-1. Subsidized* Account Holdingsand Average Annual Costs for IndividualsUnder 100% of Federal Poverty Level Accumulated pretax contribution at 0.5% or 1.0% of income * Subsidized annually at the 50% level.
Figure B-2. Subsidized* Account Holdingsand Average Annual Costs for Individualsat 100%–149% of Federal Poverty Level Accumulated pretax contribution at 0.5% or 1.0% of income * Subsidized annually at the 25% level.
Figure B-3. Unsubsidized Account Holdingsand Average Annual Costs for Individualsat 150%–199% of Federal Poverty Level Accumulated pretax contribution at 0.5% or 1.0% of income
Figure B-4. Unsubsidized Account Holdingsand Average Annual Costs for Individualsat 200%–300% of Federal Poverty Level Accumulated pretax contribution at 0.5% or 1.0% of income
Figure B-5. Unsubsidized Account Holdingsand Average Annual Costs for IndividualsAbove 300% of Federal Poverty Level Accumulated pretax contribution at 0.5% or 1.0% of income