Download
1 / 10
100 likes | 261 Views
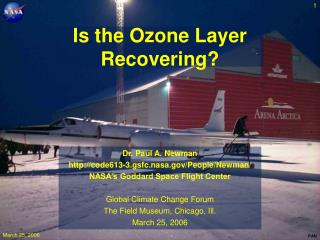
Characterizing the Boundary-Layer During the Uintah Basin Ozone Study. John Horel Erik Crosman , Matt Lammers , Alex Jacques, Nola Lucke , John Lawson, Maggie Schoonover, Erik Neemann and Joe Young University of Utah Department of Atmospheric Sciences.

E N D
Characterizing the Boundary-Layer During the Uintah Basin Ozone Study John Horel Erik Crosman, Matt Lammers, Alex Jacques, Nola Lucke, John Lawson, Maggie Schoonover, Erik Neemann and Joe Young University of Utah Department of Atmospheric Sciences
New territory: If the SL Basin is a ‘tea cup’ then the Uintah Basin is ‘large kettle’ SALT LAKE ‘BASIN’ UINTAH BASIN 20 km 45 km 200 km 140 km ‘Tea Cup’ Model LOS ANGELES BASIN 65 km 20 km
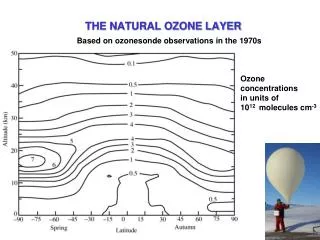
CS Sonic Anemometer Characterizing the Boundary Layer During UBOS • Boundary-layer height and the vertical structure profiles (2 ceilometers, rawinsondes) • Near-surface turbulence (sonic anemometer) • Spatial variations in BL (WRFmodel simulations, MesoWest, UU2DVAR,mobile ozone and met obs) Viasala CL31 ceilometer WRF near-surface temp (left) and terrain (right) 12 UTC Feb 13 2011 Mobile Ozone/Met
University of Utah Observations Roosevelt South (Ceilometer; Sonic Anememeter and met station; periodic rawinsonde Fort Duschesne Uintah River High School (Ceilometer; periodic rawinsonde Mobile ozone and met (various transects throughout basin)
Laser ceilometer profiles • 1800 UTC Jan 26 Rawinsonde • 23 and 25 Jan mobile ozone/met (Very) Preliminary Observations from 14-28 January Uintah Basin Cold Air Pool
Cold Air Pool Boundary-Layer Evolution Phase 2 Phase 1 Phase 1: 15-23 Jan: Persistent cold air pool in place in basin with only slight warming of boundary layer through period. Phase 2: 23-28 Jan: Dramatic warming of the boundary layer while temperature inversion remains intact (due to clouds and infrared radiative warming of boundary-layer, differential warming aloft, precipitation). End of cold air pool with frontal passage on Jan 28th.
1000 m ViasalaCeilometer Backscatter (Red high backscatter) 500 m Waves and Changes in height of primary polluted layer 0 m 9 am MST 11 am MST 6 am MST 26 Jan 26 Jan 11 am MST Rawinsonde ‘Layering’ in aerosol backscatter corresponds to distinct temperature layers in the boundary layer Saturday January 26th 1800 UTC
Boundary-Layer Evolution Noon-6 pm 20 Jan 2013 24 Jan 2013 • Top 200 m of inversion less polluted on 24 Jan than on 20 Jan • Concentrated surface layer 150 m deeper on 24 Jan than on 20 Jan
Mobile Ozone/Met Observations 25 January Ozone (ppb) Temp (⁰C) ozone high ~145 ppb ozone low ~80 ppb
UU UBOS Webpage: http://home.chpc.utah.edu/~u0198116/uintahbasin.html Ceilometers/Sonic Anemometer/Rawinsonde/mobile data available under ‘observations’