Download
1 / 22
220 likes | 385 Views
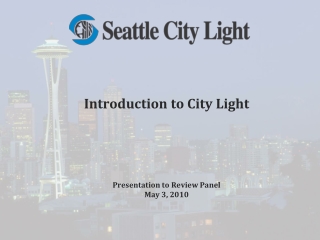
Introduction to City Light Presentation to Review Panel May 3, 2010. Seattle City Light: municipally-owned electric utility, department of the City of Seattle. City of Seattle UTGO ratings: Aaa /AAA/AAA City Light distributes power to customers in a compact 131-square-mile service territory

E N D
Introduction to City LightPresentation to Review PanelMay 3, 2010
Seattle City Light: municipally-owned electric utility, department of the City of Seattle City of Seattle UTGO ratings: Aaa/AAA/AAA City Light distributes power to customers in a compact 131-square-mile service territory Includes the City of Seattle and seven neighboring suburban franchise areas Service area population: 750,200 394,731 customer accounts served in 2009 10th largest public power utility by customers served and largest in the Northwest Rates and financial policies are set by the Seattle City Council No oversight by WUTC
2000 2002 2004 2006 2008 2010 2012 2014 2016 City Light maintains a surplus of resources to ensure retail load is reliably met Load Resource Balance • Under average hydro conditions, City Light’s three major resources provide 119% of the energy needed to meet current retail demand and are sufficient to meet projected demand through at least 2020. • City Light’s resources are spread throughout the Northwest, and consist primarily of low-cost hydro electric resources. • City Light’s owned transmission and contracts exceed its peak load requirements. 1,600 Other 1,400 Skagit 1,200 1,000 aMW Boundary System Load (includes losses and own use) 800 600 400 BPA 200 0 Demand Resources Retail Load 11,000 5.9% drop 2000-2003 10,000 • Retail demand is 67% non-residential and 33% residential. • Decline in electricity consumption has been smaller during this recession than during the previous one. 1.1% annual growth rate 2012-2016 9,000 3.3% drop 2008-2010 GWh 8,000 7,000 6,000
City Light resources are spread throughout the Northwest High Ross Equivalent Boundary Skagit Projects Skagit River Bonneville Power Administration (BPA) includes multiple projects across the Pacific Northwest Columbia River Newhalem Pend Oreille River South Fork Tolt Spokane River Cedar River GCPHA Projects Cedar Falls Priest Rapids Snake River Stateline Wind Columbia Ridge Biomass Owned Hydro Plants Long-term Hydro Contract Treaty Rights From British Columbia Long-term Green Power Contracts Boise River Lucky Peak Resource Portfolio
Boundary Hydroelectric Project • Located on the Pend Oreille River in the northeastern corner of Washington State. • Nameplate capacity: 1,070 MW • 48 MW delivered to Pend Oreille PUD • Produces about 3.8 million MWh annually under average water conditions • Supplied 27% of City Light’s total resources in 2009 • Current license expires on September 30, 2011. • On March 29, 2010, the Department filed a settlement and revised application for a new license with FERC. Skagit Hydroelectric Project • Ross, Diablo and Gorge dams on the Skagit River in northwestern Washington work as a system. • Nameplate capacity: 802 MW • Produces 2.7 million MWh annual under average water conditions • Supplied about 20% of City Light’s total resources in 2009 • Project was relicensed in 1995; the 30-year license expires in 2025.
BPA Slice and Block Contracts • City Light is a Bonneville Power Administration (BPA) preference customer, meaning that it may purchase power from BPA at cost. BPA accounted for 39% of City Light’s total resources in 2009. • Under average water conditions, BPA supplies City Light with approximately 5.4 million MWh • The Block contract currently provides for the delivery of a shaped monthly load of 237 annual aMW. This energy is guaranteed and is not dependent on water conditions. • The Slice contract provides a fixed 4.67% of the BPA output in exchange for paying the same percentage of system costs. This amount fluctuates with water conditions. • Under average water conditions, the Slice Product provides approximately 373 annual aMW of energy. • The new BPA contract starts in 2011 and runs through 2028. Current BPA Block and Slice contracts extend until September 30, 2011. • Under the new contract, City Light’s Slice percentage will be 3.66% and the Block will be approximately the same, with energy received totaling approximately 505 aMW under critical water conditions. Conservation and renewable resources • Cumulative annual conservation savings since 1977: approximately 1,138,800 MWh or 130 aMW as of 2009. • Five-Year Conservation Plan 2008-2012: 574 GWh (65.5 aMW) accumulated savings over five years. • I-937-compliant renewable resources = estimated 5% of retail load in 2010: Stateline Wind (47 aMW), Columbia Ridge (6 aMW), Burlington SPI Biomass (3 aMW) • I-937 requirements for 2012 target will be met with existing resources. An additional 43 aMW in resources or RECs will be needed to meet the 2016 target, plus 76 aMW for 2020. • City Light is currently evaluating incremental renewable resources and conservation to meet future load growth • Greenhouse-gas neutral since 2005.
City Light’s customers’ bills are among the lowest in the region and the country (1) Publicly owned. (2) Includes temporary surcharge to fund RSA, effective May 1, 2010. City Light Rate History 2009 Avg System Rate (cents/kwh) Local Utility 1. Tacoma (1) 5.57 Seattle (2010) (1) 6.83 (2) 2. 3. Snohomish (1) 7.42 4. Avista 7.87 5. Puget Sound Energy 9.02 6. Portland General 9.11 • Per Washington State law, City Light cannot use rate revenue to fund general City improvements. • In 2002, a court ruling specifically prohibited City Light from using ratepayer funds to pay for City streetlights. • BPA rates are automatically passed through per City Council ordinance. 7
City Light’s revenues are primarily distribution-based • Retail energy sales accounted for 75% of City Light’s revenues in 2009 • Top 10 customers, from diverse business sectors, make up only 17% of total retail revenues • Wholesale energy sales are a substantial but variable revenue source • Revenues depend on hydro run-off and natural gas prices in the Northwest • City Light forecasts both factors conservatively • Creation of Rate Stabilization Account further limits City Light’s wholesale market exposure Total 2009 Revenue = $723 million Exchanges, Transmission, Other Power - Related $67 million Wholesale Power Sales $89 million Retail Energy Sales $545 million Other $23 million
City Light’s Expenditures Controllable expenditures are a relatively small portion of the overall budget O&M Spending has been reduced by 12.5% from the level established in the 2010 endorsed budget 9
Historical Operating Results See page 43 [may change] in POS for notes to Historical Operating Results table.
In the wake of the 2001 energy crisis, City Light took strategic steps to improve its financial strength • City Council raised rates substantially and instituted strong financial policies aimed at reducing exposure to energy market risk and improving financial strength. • 2.0x planned debt service coverage. • 95% confidence of positive cash available to fund capital program. • Target of 60% debt to capitalization by 2010. • $25 million contingency reserve fund. • Resources beyond that needed to meet retail load were acquired, which positioned City Light as a net seller of energy. • Long energy position provides a natural hedge against worst-case low hydro / high price scenario. • Wholesale energy sales of surplus hydropower provide a substantial source of revenue. • Strong forecasting, power trading and risk management programs were developed to track and manage energy market risk. 11
Demonstrated financial results Demonstrated financial results Net Income (Loss) Net Operating Revenue $200 $200 $150 $150 $100 $100 $M $M $50 $50 $0 $0 2005 2006 2007 2008 1999 2000 2001 2002 2003 2004 1999 2000 2001 2002 2003 2004 2005 2006 2007 2008 -$50 -$50 -$100 Debt as Percent of Total Capitalization 1st and 2nd Lien Bonds Debt Service Coverage 90% 2.5 85% 2.0 80% 1.5 75% 1.0 70% 0.5 65% 60% - 2005 2006 2007 2008 2004 1999 2000 2001 2002 2003 1999 2000 2001 2002 2003 2004 2005 2006 2007 2008
Market conditions in 2009 and 2010 led to short-term and longer-term responses • The economic recession and falling energy prices reduced net wholesale revenues from the $130-$140 million range in 2006-08 to $68 million in 2009. • Action taken by City Light and the City Council • Spending reductions of $94 million in 2009 helped to preserve operating cash • 13.8% rate increase approved for 2010 intended to meet interim financial policies, including 1.80x debt service coverage • Changes made to financial policies introduce a mechanism to provide greater financial stability when wholesale revenues deviate from projected amounts • Record warm winter temperatures and low snowpack are causing City Light to anticipate even lower wholesale revenues for 2010. As a result, debt service coverage in 2010 is expected to be approximately the same as in 2009.
New financial policies enhance financial stability • City Light’s current financial policies established by City Council on March 22, 2010. • Establishment of a Rate Stabilization Account (RSA) with automatic rate changes to replenish. • Target size: $100 million - $125 million; to be fully funded by 2011 • Rate setting guideline: 1.8x debt service coverage ratio. • Debt policy targets funding at least 40% on average of the six-year capital program via cash from operations. • Policy review at end of year 2011 to ensure RSA’s effectiveness at protecting City Light from wholesale revenue volatility.
Rate Stabilization Account will mitigate wholesale revenue uncertainty • The RSA will be called on to supplement revenue when actual wholesale revenue is below the forecasted amount on which retail rates are predicated. Similarly, incremental wholesale revenues above the baseline will be added to the RSA. • Prescribed actions when fund falls below: • Automatic 4.5% surcharge effective for 2010, beginning May 1, 2010.
City Light maintains a comprehensive risk management program, with a focus on addressing wholesale energy risk 16 16
6-Year CIP and Funding Sources 6-Year CIP Funding Sources Operations 34% Bond Proceeds 54% Grants & CIAC 12% 46% of CIP is funded on a pay-as-you-go basis.
Strategic Issues Facing City Light Strategic Outlook 18 18
Even assuming critical water conditions, no additional resources are required until 2017 Resources Load 2010 IRP System Load Forecast and Existing Firm Resources* (Preliminary) 1,600 1,500 1,400 1,300 1,200 Annual Energy (aMW) 1,100 Need will be met with conservation and green resources. 1,000 900 800 700 600 2021 2010 2011 2012 2013 2014 2015 2016 2017 2018 2019 2020 2022 2023 2024 2025 2026 2027 2028 2029 *Firm resources denotes power generated under critical water, not expected conditions. Strategic Outlook 19
City Light is a leader in conservation and carbon reduction initiatives • Cumulative annual conservation savings since 1977: approximately 1,138,800 MWh or 130 aMW as of 2009. • 5-Year Conservation Plan 2008-2012: 574 GWh (65.5 aMW) accumulated savings over 5 years. • Renewables • Stateline Wind: 175 MW contract capacity, average output 45 aMW • Columbia Ridge: landfill gas plant, 6 aMW • Burlington SPI Biomass, contract average output 3 aMW • I-937 requirements for 2012 target will be met with existing resources. An additional 43 aMW in resources or RECs will be needed to meet the 2016 target, plus 76 aMW for 2020. • Planned future resources • King County West Point in 2013, 2 aMW • Upgrade 2 turbines at Boundary in 2016, 5 aMW • Upgrade Gorge to add second tunnel in 2016, 5 aMW • Greenhouse-gas neutral since 2005 Strategic Outlook 20
City Light is proactively managing its assets and infrastructure • Asset management program vision: manage our assets for the greatest benefit of City Light’s customers at lowest lifecycle cost. • Comprehensive asset inventory records • Pole inspection and replacement program • Work management, outage management and asset inventory software • Performance metrics and decision process to support investment allocation • Five-year implementation plan began in 2008. • 2010-12 implementation funded at $43 million ($20.4 million CIP). • Expected benefits • Consistent use of asset information for investment decisions • Standard, consistent, repeatable processes with process and performance metrics • Customers enjoy higher system reliability, and ultimately lower rates • Early Smart Grid planning is already having an impact on asset procurement decisions. Strategic Outlook 21
In Summary: City Light’s Strengths The City of Seattle’s UTGO ratings are Aaa/AAA/AAA. Seattle’s local economy is diverse and resilient. A large and diverse distribution system provides stable revenue stream. City Light’s strong resource portfolio features low-cost hydropower and renewables. Since 2001, City Light has maintained a surplus of power to meet customer needs. City Light is carbon-neutral and expects to meet future load growth through conservation and renewable energy. City Light’s rates are among the lowest in the Pacific Northwest and urban America. The City Council has acted to adjust rates as necessary to maintain City Light’s operational and financial performance. City Light has ready access to cash via the City’s large investment pool. New financial policies enhance financial strength and the Rate Stabilization Account improves revenue stability.