Download
1 / 49
490 likes | 587 Views
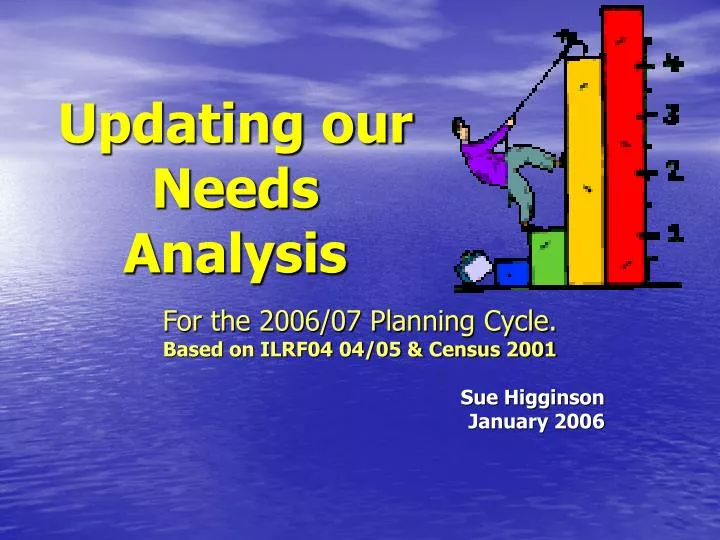
Updating our Needs Analysis. For the 2006/07 Planning Cycle. Based on ILRF04 04/05 & Census 2001 Sue Higginson January 2006. Turning data into information. Part 1 About the Wirral Community Part 2 About the FE Market in Wirral Part 3 About our student population

E N D
Updating our Needs Analysis For the 2006/07 Planning Cycle. Based on ILRF04 04/05 & Census 2001 Sue Higginson January 2006
Turning data into information Part 1 About the Wirral Community Part 2 About the FE Market in Wirral Part 3 About our student population Part 4 What does this mean to us?
Turning data into information Part 1 About the Wirral Community Part 2 About the F E Market in Wirral Part 3 About our student population Part 4 What does this mean to us?
About the Census data:Source: 2001 Census • There are 32,482 Super Output Areas (SOAs) in England. • 201 of the 1000 most-deprived SOAs areas are in Greater Merseyside. • 15 of the most deprived 500 are in Wirral. • 5 of the most deprived 100 are in Wirral.
7 indicators to determine deprivation • Income. • Employment and Training. • Health and Disability. • Education / Skills / Training. • Housing • Environment • Crime
About the Census data: Of the 354 Local Authority Districts Wirral is: 14th – Most deprived, overall 7 indicators. 30th – education-related deprivation.
The districts of: Bidston Birkenhead Seacombe Tranmere Parts of: Leasowe Liscard New Brighton Upton Key areas of deprivation:
Unemployment in Wirral:Source: Annual Population Survey (Apr 04 – Mar 05)
Industry – of Employmentrelated to local area - Source: LSC Dec 04 • Manufacturing. • Wholesale and retail trade. • Health & Social Care. • Real Estate. • Education. • Public & Administration. • Transport. • Other community. • Financial intermediation. • Hotels and Restaurants.
LSC Focus for G. Merseyside. • Manufacturing. • Wholesale and retail trade. • Health & Social Care. • Real Estate. • Education. • Public & Administration. • Transport. • Other community. • Financial intermediation. • Hotels and Restaurants.
Ethnicity in Wirralsource: 2001 Census • 98.3% White • .6% Mixed • .5% Chinese • .4% Asian / Asian British • .2% All other groups.
Age profile of Wirral source: 2001 Census Average Age in Wirral - 40
Health in Wirral source: 2001 Census 22.5% of Wirral population with a Long Term Illness.
Basic Skills needs in Wirral Estimates of Wirral People with: Poor Literacy 46,602 Poor Numeracy 47,738 Approx 25% of the population details by ward available.
Turning data into information Part 1 About the Wirral Community Part 2 About the FE Market in Wirral Part 3 About our student population Part 4 What does this mean to us?
Market DEMAND in WirralSource (National ILR for 03/04 RCU analysis) Population (16-64) 218,832 Wirral participation (02/03) 32,239 15% 1,442 more than previous year
Market share– v – Gender profile(change from previous year shown in brackets)
The answer is……… 459 (229 have less than 5 learners)
Key themes based on Wirral Market: • School 6th Forms (collectively) dominate 16-18 but participation rates concentrated in Wallasey and South Wirral. • We are the largest single provider of 16-18 learning for Wirral. • We have a small WBL market – by design – with Scientiam managing all MAs for us.
Turning data into information Part 1 About the Wirral Community Part 2 About the FE Market in Wirral Part 3 About our student population Part 4 What does this mean to us? NB: Background demography to inform the curriculum strategy.
Our Top 5 Wirral ‘WARD’ participation. • 1st - Seacombe 715 • 2nd - Birkenhead 696 • 3rd - Liscard 589 • 4th - New Brighton 583 • 5th - Claughton 575
Learners per CL Area (FT+PT)Source: ILRF04 2003/04NB 3% overall for rounding
Our Learner Profile includes: Age profile 16-18 5,562 learners 19+ 19,462 learners WP – Postcode uplift 47% Gender profile 67% F 33% M
WP Trends based on postcode shows significant improvement through our recovery period
Ethnicity A very positive college profile!
Performance of EDIM Groups: College Av 71% Nat. Av 65%
Turning data into information Part 1 About the Wirral Community Part 2 About the FE Market in Wirral Part3 About our student population Part 4 What does this mean to us?. NB: Presentation to support more detailed Report.
Foster Agenda for Change C.I.F. Key ‘Themes’ largely remain the same. L.S.C.
National Priorities • 16-18 year olds. • Those without a First Level 2 qual. • Skills for Life (Basic Skills) • Apprenticeships. • 14 – 16 – increasing vocational options to ‘join up’ 14-19 voc entitlement. • Increasing the contribution and engagement of employers.
Regional Priorities • Basic Skills. • First Level 2 skills. • Entry routes for job-seekers. • Skills – to meet sector skills challenges. (inc. Leadership & Management skills) • Disadvantaged • Those on long term incapacity benefit. • Engaging employers.
In Summary What does this mean for us?
Four Key themes • What are we doing to tackle the basic skills agenda? • An estimated quarter of our local community have basic skill needs. • 90% of ALL FT Learners assessed last year have Numeracy at Level 1 or below. • This is also a priority funding area.
Four Key themes 2. Do we have ‘real’ access and progression opportunities to meet the vocational training needs of the area? • We have a diverse curriculum to meet skill needs but are the vocational opportunities at the right level? (Entry routes for job seekers) • Apprenticeships – within this portfolio. • How is each vocational area engaging with their employer/industry? (Employers as strategic partners, customers and stakeholders)
Four Key themes 3. How can we become more responsive to employers? • ‘First Level 2’ qual – we need access to and through L2 in all voc areas. • Level 3 – Higher employer contribution expected - reduced LSC funding likely. • ‘College for Business’ Agenda.
Four Key themes 4. What about HE? • Are we offering the right courses? • Are we maximising links with employers in building this business? • The development of Foundation Degrees.
All of which is underpinned by The need to: • HIT funding targets - recruitment. • Grow new full cost business. • Continue to improve retention, achievement and success rates.
Please use to inform planning and keep this copy in your Quality File linked to Needs Analysis.