Download
1 / 22
220 likes | 334 Views
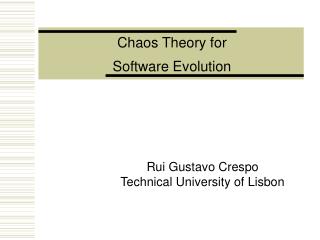
Rui Gustavo Crespo Technical University of Lisbon. Laws of Software Evolution (1). MM Lehman informal laws of software evolution 1 Continuing change : a program used in a real-world environment must change.

E N D
Rui Gustavo Crespo Technical University of Lisbon
Laws of Software Evolution (1) • MM Lehman informal laws of software evolution1 • Continuing change: a program used in a real-world environment must change. • Increasing entropy: the program structure becomes more complex, unless efforts are made to avoid the complexity. • Statistically smooth growth: the global system metrics appear locally stochastic in time and space but are self-regulating and statistically smooth. 1Lehman, M.M.: Programs, Life Cycles and Laws of Software Evolution. IEEE Special Issue on Software Engineering, 68(9), 1060-1076
Laws of Software Evolution (2) • Valid laws must be:- • Unambiguous: the underlying system model must be clear (better formally). • Falsifiable: model predictions are checked against collected data and the law remains valid until tests fail. • Thesis: • Program organization plays a role in maintenance, and may be measured with LRC (“Long-range correlation”) metrics. • Program evolution follows Verhulst population model.
F2(l) = [DBW(l,l0)]2 - [DBW(l,l0)]2 • DBW(l,l0) = BW(l0+l)-BW(l0) LRC metrics (1) • Encode symbols (data types int, struct,... and instruction keywords if, while,...) with a balanced numeric code. • Identify the Brownian walk graph BW BW(0) = 0 BW(n) = BW(n-1) + Code(Sn) • Evaluate the root of mean square flutuation about the average of displacement.
LRC metrics (2) • F(l) la • a = 0.5, random programs • 0.5<a<1, meaningful programs
LRC metrics (3) [A] a values for 36 compilers, coded in C Average: 0,82
LRC metrics (4) • for 36 random programs, same keyword distribution (similar results for same number of lines) Average: 0,48
LRC metrics (5) a values for 36 random C programs, same number of lines, same keyword distribution Average: 0,62
LRC metrics (6) a values for source and object files are strongly correlated
Verhulst model, or logistic map Process dynamics (1) Pierre Verhulst, Belgian mathematician, studied models of human population growth in the 19th century • Growth with unlimited resources du/dt=gu, g>0 Solution is an exponential function u(t)=u(t0)eg(t-t0) • Growth with limited resources du/dt=b(-u)u, is the upper limit Xt+1 = P Xt(1-Xt) Xt \in[0,1], P\in[0,4]
Process dynamics (4) Oscilation period is 2n
Process dynamics (5) BTW, predator and prey populations (e.g., wolves and rabbits), are ruled by the same kind of equations • dr/dt=b1(1- w)r • dw/dt=b2(r - 2)w Solution of the differential equations are sinusoidal functions, with different phases
Process dynamics (6) The behaviour is cahotic
Process dynamics (7) • Software processes also “compete” for resources (time, man-power, …) • Interaction between components is non-linear: small changes in a module may stop other modules to work properly • Proposal: link Verhulst P values to • Program organization, and • Ideas formation
Ideas formation Ideas covergence Single Idea Implementation Information Criativity Product Attributes Normal Bifurcation Chaos Process Form P 3,0 3,4 0 Time Process dynamics (8) anorm = 2|a-0.5|; P = at+1/at(1-at)
Process dynamics (9) BeanMetaData.java versions in JBOSS (Jul 2000-Oct 2002) Bifurcation Chaotic Normal
Process dynamics (11) EJBVerifier20.java versions in JBOSS (May 2000-Sep 2002) Chaotic Bifurcation Normal
Conclusions • It is possible to measure program organization and automatically highlight version behaviours • Next steps: • Check LRC validity and Verhulst model in other applications / languages / process phases • Improve Verhulst model (sometimes, P>4) • Identify faster a algorithms Cardoso,AI; Kokol,P.; Lenic,M.; Crespo,R.G.; Complexity-based Evaluation of Systems Evolution; in Advances in UML/XML Based Software Evolution;IRM Press; 2004 (in print)