Download
1 / 19
260 likes | 712 Views
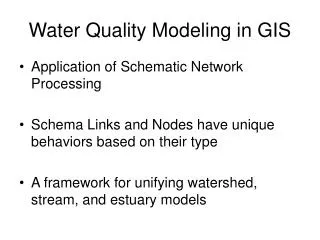
Water Quality Modeling in GIS. Application of Schematic Network Processing Schema Links and Nodes have unique behaviors based on their type A framework for unifying watershed, stream, and estuary models. Two Case Studies. Galveston Bay Bacteria Study

E N D
Water Quality Modeling in GIS • Application of Schematic Network Processing • Schema Links and Nodes have unique behaviors based on their type • A framework for unifying watershed, stream, and estuary models
Two Case Studies • Galveston Bay Bacteria Study • Application of Model Builder (Arc Toolbox 9.0) • Guadalupe River Nitrogen Study • Application of SPARROW for load estimation
SPARROW • Regional-scale statistical water-quality model • Developed by USGS • Estimates load of pollutant for each sub watershed within a monitored basin using SAS • Has been applied to continental US, Mississippi Basin, and Northeastern US
414 National Stream Quality Accounting Network (NASQAN) Stream Monitoring Locations
The Guadalupe River at Victoria Texas Basin Red represents along stream flow Green represents land to channel flow
Schematic Network Processing Algorithm Upstream Load = 50 kg/yr Land Surface Load = 100 kg/yr Load = 50 x dchannel +100 x dsurface dchannel = decay due to travel along river channel transport dsurface= decay due to land surface to river channel transport
Future Direction: Improve Data Resolution 1:500,000 1:24,000