Download
1 / 45
570 likes | 1.04k Views
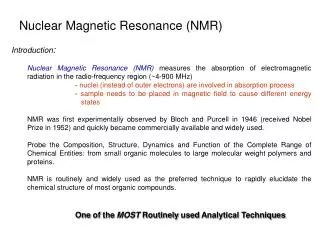
Nuclear Magnetic Resonance (NMR) Spectroscopy. Dr. Vincent J. Storhaug. Spectrometer Tuning. Lock. 1. 4. 1H-19F. X Channel. Proton. X Channel. Proton. X Channel. Spectrometer Drift: Locking. Time. Resonance Frequency.

E N D
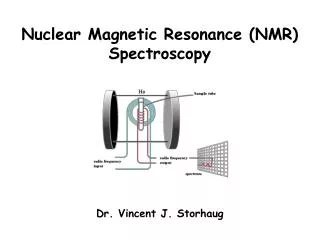
Nuclear Magnetic Resonance (NMR) Spectroscopy Dr. Vincent J. Storhaug
Spectrometer Tuning Lock 1 4 1H-19F X Channel Proton X Channel Proton X Channel
Spectrometer Drift: Locking Time Resonance Frequency • We DO want to use one of the frequencies as a “feedback loop” to correct for any drift in the field with time. • We DO NOT want to use one of the frequencies that we wish to “observe” – Heisenberg Uncertainty Principle.
Using the Spectrometer Lock for Shimming • What is Shimming? In order for signals to be symmetrical and “sharp”, the magnetic field must pass through the sample homogeneously; however, there are problems: • NMR Tube never filled to EXACTLY the same level. • Different deuterated solvents do not have the same physical properties, e.g. – VISCOSITY • NMR tube may never be inserted at EXACTLY the same orientation in the sample holder, i.e. - spinner. • Microscopic particulates/colloidal particles. • Tube quality may not be the same: • Wilmad • Norell • Kontes • Aldrich (Fisher) • Chemglass • How do we correct for these problems?
Using the Spectrometer Lock for Shimming Shim Stack
Purpose of the Phase Cycle • Unwanted COHERENT signals can be received from a variety • of sources: • Imbalance of spectrometer hardware • Coherent noise (rf “pickup”) • Artifacts generated by multipulse techniques (2D) • Other sources • The way to distinguish noise from signal is to phase cycle the pulse and the • “phase sensitive” detector. • Actual phase cycle depends on the nmr technique • Typically for a 1D experiment, you have a phase cycle of 4 or 8 • Should always make the number of scans a multiple of the phase cycle x Receiver Phase Pulse Phase O (+x) O (+x) y 9O (+y) 9O (+y) 180 (-x) 180 (-x) 270 (-y) 270 (-y)
Purpose of the Phase Cycle O (+x) 180 (-x)
Terminology: Chemical Shift () Due to the presence of shielding electron(s), the magnetic field strength effectively interacting with the nucleus is always slightly weaker than the applied magnetic field. B0 magnitude of the resultant magnetic field Bappl magnitude of the applied magnetic field σscreening constant Revisiting the Resonance Frequency:
Terminology: Chemical Shift () Step 1: Define a reference point: Internal reference used is tetramethyl silane (TMS): methyl groups are isolated from one another, and all hydrogen nuclei are magnetically equivalent. In addition, the screening constant for TMS is much larger than for most other hydrogen nuclei in organic compounds. Step 2: Define an abscissa scale: We know that the resonance frequency is dependent on the strength of the magnetic field. What would be useful is a scale which allows us to compare spectra directly from spectrometers which use different applied field strengths – i.e. – an abscissa value that is independent of the applied field strength. νr resonance frequency of reference (TMS for 1H NMR) νs resonance frequency of sample nucleus
Terminology: Chemical Shift () Since we know that (for a 1H NMR spectrum with TMS as the internal reference) σr << 1, we have
Terminology: Chemical Shift () Step 2: Define an abscissa scale: (cont.) To make the value more “manageable”, we apply the following definition: Skoog, et al., defines the chemical shift parameter δ as And provide it with the units ppm, i.e. - parts per million.
Terminology: Chemical Shift () 2.00 1.00
Origin of the Shielding Which Leads to Differences in the Observed Chemical Shifts • The closest electrons to a nucleus are those that bond the nucleus to its neighboring atoms. • Under the influence of a magnetic field, bonding electrons tend to precess in a plane which is perpendicular to the applied field. • Any factor that effects the distribution of these bonding electrons will also effect the degree of shielding the nucleus experiences. Therefore, the electronegativities of the surrounding bonded atoms are an extremely important factor that will alter the distribution of bonding electrons. Circulating Electrons B0 Opposing Field of σB0
Origin of the Shielding Which Leads to Differences in the Observed Chemical Shifts
Origin of the Shielding Which Leads to Differences in the Observed Chemical Shifts
Origin of the Shielding Which Leads to Differences in the Observed Chemical Shifts
Origin of the Shielding Which Leads to Differences in the Observed Chemical Shifts δ 2.9 HC CH H2C CH2 5.8 Increasing Electronegativity H3C CH3 0.9 Effect is caused by magnetic anisotropy. This is a molecular level distortion of the applied magnetic field caused by a “ring current”.
Shielding Effects: Why We Obtain a Spectrum for the Sample • Circulation of electrons within molecular orbitals results in local magnetic fields that oppose the applied magnetic field. • A higher shielding of the nuclear results in a lower Befffor the nucleus of interest. A smaller value for B means a slightly lower energy of transition.
Origin of the Shielding Which Leads to Differences in the Observed Chemical Shifts Ring Current H H B0 σB0 σB0 Opposing Field Note the direction of the field for the hydrogen nuclei. The magnetic field induced is constructive for the hydrogen nuclei with respect to B0, not destructive.
Origin of the Shielding Which Leads to Differences in the Observed Chemical Shifts δ 2.9 HC CH H2C CH2 5.8 Increasing Electronegativity H3C CH3 0.9 Effect is caused by magnetic anisotropy. This is a molecular level distortion of the applied magnetic field caused by a “ring current”.
Origin of the Shielding Which Leads to Differences in the Observed Chemical Shifts H H C C B0 H H H C B0 C H
Shielding Effects: Why We Obtain a Spectrum for the Sample • Circulation of electrons within molecular orbitals results in local magnetic fields that oppose the applied magnetic field. • A higher shielding of the nuclear results in a lower Befffor the nucleus of interest. A smaller value for B means a slightly lower energy of transition.
A B Origin of Spin-Spin Splitting Spin-spin splitting occurs when the magnetic moment of one nucleus (µA) interacts with the magnetic moments of immediately adjacent nuclei (µB, µC, etc.). Polarization Interaction: where the magnetic coupling of nuclei is transmitted through bonding electrons. The coupling can only travel so far through bonds and still be “effective”/observable. Because these effects are transmitted through bonding electrons, they are independent of the applied magnetic field. Thus, for a given (type of) nucleus, the chemical shift remains the same, and only the pattern of the signal changes.
Origin of Spin-Spin Splitting CH3-CH2-OH Energy B0
Origin of Spin-Spin Splitting CH3-CH2-OH Because the neighboring nuclei opposeB0, the magnetic field felt by the methyl protons is lessened. Energy B0
II III I Origin of Spin-Spin Splitting CH3-CH2-OH I II Energy B0 III
Origin of Spin-Spin Splitting Example: ethanol CH3-CH2-OH Energy B0
Origin of Spin-Spin Splitting CH3-CH2-OH I II III Energy B0 IV
Origin of Spin-Spin Splitting CH3-CH2-OH
Singlet Doublet Triplet Quartet Multiplets Patterns of Splitting: Pascal’s Triangle
Rules Governing the Interpretation of First Order Spectra In, first-order spectra, the chemical shift (value) between interacting groups of nuclei is large with respect to their coupling constants, J. To “guarantee” first-order behavior, J/δ ≤ 0.05 However, in most cases a larger value will still allow approximation of first-order responses. Equivalent nuclei do not split each other. Coupling constants decrease in magnitude rapidly with physical separation of the groups of nuclei. Coupling is rarely observed along more than four bonds. The n + 1 rule applies, where n is the number of magnetically equivalent nuclei attached to a neighboring atom. If coupling exists for nuclei B with both nuclei A and C, then the multiplicity of B is given by the function (nA + 1)(nC + 1).
Rules Governing the Interpretation of First Order Spectra The approximate relative areas of the multiplet are determined by the patterns found in Pascal’s Triangle. Since coupling constants are independent of the field strength, we can distinguish a multiplet from individual closely spaced signals by running the sample at a different field strength. Reminder: The chemical shift is independent of the field strength, but the resonance frequency is not.
Second Order Spectra When J/δ becomes greater than 0.10, the rules for first order spectra do not apply. As δ approaches J in magnitude, the peaks on the “inner” sides of the multiplets get enhanced at the expense of the peaks on the “outer” sides. (Remember that the total area must remain the same.) More lines than might be expected by applying the “nearest neighbor” rule may be visible. (i.e. – Coupling is observed along four or more bonds.)
Spectra Involving Chemical Exchange Processes Pure dry liquid ethanol. Ethanol containing a very small amount of HCl. Note: in this case there is no change in chemical shift(s), only in splitting pattern(s).
Spectra Involving Chemical Exchange Processes The observed signal is the result of the weighted average of the nucleus in its different magnetic environments. Fast exchanges show up as sharp signals. Exchanges on the NMR timescale (“intermediate”) show up as broad signals. (presence of acid/base catalyst, temperature, nature of the solvent, etc.) Slow exchanges will show two separate lines.
Terminology: Chemical Shift () 1.00 ppm 400.00 Hz 399.978 Hz 7 5 3 1
HA HB HC HD Coupling Constants in Different Field Strengths ν0 = 399.978 MHz
Coupling Constants in Different Field Strengths ν0 = 399.978 MHz HA HB JAB JBA
Coupling Constants in Different Field Strengths ν0 = 399.978 MHz HA JAB JAC JAC
Coupling Constants in Different Field Strengths ν0 = 399.978 MHz 10 Hz 4 Hz 4 Hz 10 Hz ν0 = 499.983 MHz 4 Hz 4 Hz
Coupling Constants in Different Field Strengths ν0 = 399.978 MHz 10 Hz 4 Hz 4 Hz 12.5 Hz ν0 = 499.983 MHz 4 Hz 4 Hz