Download
1 / 23
230 likes | 418 Views
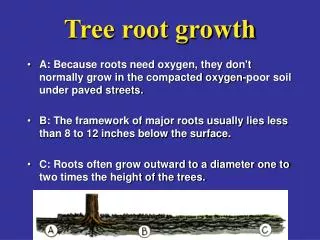
Mapping Street Tree Canopy Growth. Using ArcMap to Geocode Street Tree Locations and Project Potential Canopy Growth. Mapping Street Tree Canopy Growth. Presentation Overview. Methods used to Project Canopy Growth Why use GIS for projections? Summary of Data Sources

E N D
Mapping Street TreeCanopy Growth Using ArcMap to Geocode Street Tree Locations and Project Potential Canopy Growth
Mapping Street Tree Canopy Growth Presentation Overview • Methods used to Project Canopy Growth • Why use GIS for projections? • Summary of Data Sources • Explanation of Tree Crown Growth Rates • Method of Geocoding • Review of Results • Strengths and Weaknesses of Project
Mapping Street Tree Canopy Growth Methods used to Project Canopy Growth • Geocoded Street Tree Data: Using actual tree planting species and location data, I attempted to geocode 3,427 street trees that were planted from 1/07-4/09 (74 species). • Assigned Tree Growth Rates: I assigned tree growth rates based on USFS data. • Attempted to Project Canopy Growth: Using the tree growth data, I projected potential canopy growth at 10, 20, 30, 40, and 50 years from tree installation (using buffers).
Mapping Street Tree Canopy Growth Why GIS for Projecting Canopy? • Tree planting projects over the last 10 years have provided over 100,000 new Los Angeles street trees, but few have explored potential temporal changes. • To explore possibilities of using data in a manner easily understood by funders and policy makers. • Even though tree inventory software exists, most are expensive and are an “outside” source of inventory and information. A complete, centrally (municipality) controlled GIS tree inventory, linked to all other City asset databases, is possible and likely most flexible.
Mapping Street Tree Canopy Growth Summary of Data Sources • Tree species and location data: Collected from actual data from projects from 1/07-4/09. • Tree Crown Growth Rates: Obtained from USFS studies and publications. Also compared data to reference sources. • Aerial Imagery: ESRI World Imagery Basemap (1-Meter resolution). • Other: Los Angeles Council District Map (City), CRA Project Map (CRA/LA).
Mapping Street Tree Canopy Growth Crown Growth Rates - Background • I assigned trees that were planted, by type, into a format the USFS uses – a simple 12 category (type) grouping. Trees with similar attributes – including height and crown size are grouped together: Groups: BDS - Deciduous small BDM - Deciduous medium BDL - Deciduous large BES, M, and L - Evergreens CES, M, and L - Conifers PES, M and L - Palms
Mapping Street Tree Canopy Growth Crown Growth Rates - Limitations • Problem 1– The USFS data I used included 42 species applicable to California, but only 18 of those species were ones that were actually planted! • Problem 2– Of the 42 species, approximately half are from measurements in Santa Monica, but the other half are from Modesto. • Problem 3- No other applicable, publicly available sources of tree growth rates exist (besides educated guesses).Calpoly Pomona’s SelecTree, for example, is not allowed by contract to provide anything more than what is on their website.
Mapping Street Tree Canopy Growth Crown Growth Rates -Methods applied • USFS crown growth data were averagedfor each type at 10, 20, 30, 40, and50 year measurements. • The averages were applied to each treebased on type.
Mapping Street Tree Canopy Growth From USFS: Average growth rate (for type BES) applied to project trees:
Mapping Street Tree Canopy Growth Crown Growth Rates – Use of Buffers • Tree crown growth data was added as attributes, based on the methods described, and buffers were applied. • Single symbol colors were added for each 10 year interval
Mapping Street Tree Canopy Growth Geocoding – Methods and Results
Mapping Street Tree Canopy Growth Geocoding Results (overview) CD13 CD4 CD1 CD10 CD9 CD8
Mapping Street Tree Canopy Growth Geocoding Results: Council District 10
Mapping Street Tree Canopy Growth Geocoded Locations
Mapping Street Tree Canopy Growth Year 10 Crown Growth
Mapping Street Tree Canopy Growth Year 20 Crown Growth
Mapping Street Tree Canopy Growth Year 30 Crown Growth
Mapping Street Tree Canopy Growth Year 40 Crown Growth
Mapping Street Tree Canopy Growth Year 50 Crown Growth
Mapping Street Tree Canopy Growth Review of Results – Canopy Creation by Year Potential crown growth (calculated by ArcMap):
Mapping Street Tree Canopy Growth Weaknesses of Project Method • Tree crown growth rate data was averaged by type and not specific to species. • Due to the lack of crown growth data, some measurements from Modesto were used (local source data should be used). • Geocoding used 20-foot side offset – on wide streets, some trees did not reach the parkway. • Location data needs to be derived from a dynamic central source - property data and attributes change constantly. • This method will only produce estimates without field-collected spatial data by GPS handheld, combined with the best imagery. • This project did not consider mortality. • This project did not include height, more valuable if it did.
Mapping Street Tree Canopy Growth Strengths of Project Method • It is capable of providing accurate estimations on smaller scale projects. • Could be a good visual tool for funders and decision-makers. • Its methods can easily be modeled to projects. • Provides asset inventory as well as projections. • Provides easy and accurate way to select features by area or attribute(such as new trees located within Wilshire Center/Koreatown CRAProject area).
Mapping Street Tree Canopy Growth Questions?