Download
1 / 50
500 likes | 578 Views
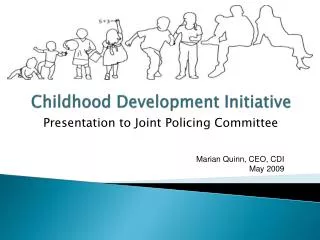
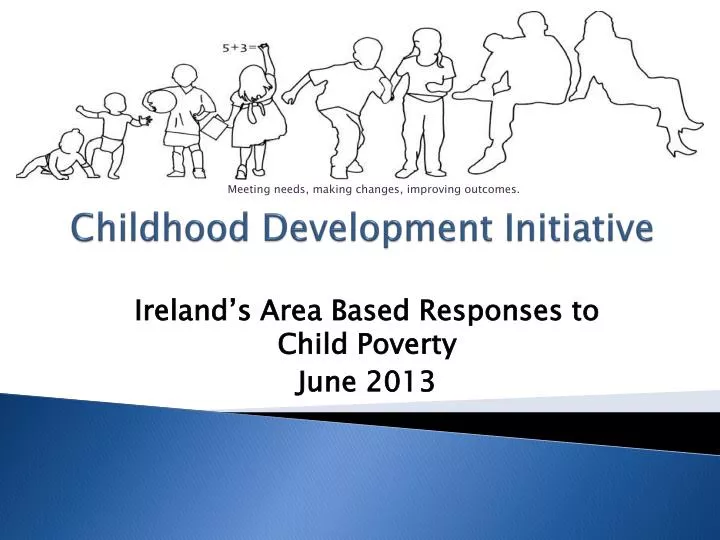
Childhood Development Initiative. Meeting needs, making changes, improving outcomes. Ireland’s Area Based Responses to Child Poverty June 2013. Overview. The Irish Context; Tallaght West: A Disadvantaged Community; CDI: Meeting needs, making changes, improving outcomes;

E N D
Childhood Development Initiative Meeting needs, making changes, improving outcomes. Ireland’s Area Based Responses to Child Poverty June 2013
Overview • The Irish Context; • Tallaght West: A Disadvantaged Community; • CDI: Meeting needs, making changes, improving outcomes; • The essence of a community response to child poverty. Meeting needs, making changes, improving outcomes.
Ireland Then! Meeting needs, making changes, improving outcomes.
Meeting needs, making changes, improving outcomes. What’s Changed?
Ireland Now Meeting needs, making changes, improving outcomes.
Irish Demographics • Total population: 4.6m compared with 4.2 2006, an increase of 8.1 per cent i.e. an annual average increase of 68,284, or 1.6 per cent (CSO, 2011); • Largely homogenous population; • Significant rural areas remain; • Little industry; • Economic reliance on service sector.
Population Growth • Components of population change (average figures from each inter-censal period, 1956-2011)
Population Growth 2 • Significant population increase between 1991 and 2002; • History of emigration until 1990’s; • Immigration relatively new concept; • Recent return of emigration in the context of the fiscal downturn and correlating population reduction.
People at risk of poverty or social exclusion Percentage of individuals Source: Eurostat
Economic Context • Significant economic growth during ‘Celtic tiger’ (commenced late 1990’s/2000); • Recession since 2008; • Europe – wide Euro crisis and austerity measures; • Significant tension between public vs. commercial sector; • Major public reform agenda.
Poverty • Poverty is measured nationally using a Deprivation Index developed by Trutz Haase and Jonathan Pratschke; • The Census of Population measures the overall national affluence and deprivation at the level of 18,488 ‘Small Areas’; • The index reveals the dramatic decline in relative affluence, represented in the fall of the mean index score from 0 in 2006 to -7.0 in 2011; • 18.6% of children in Ireland are at risk of poverty.
Risk Factors • “Children of mothers with no educational qualifications are six times as likely as children of mothers with third level education to be multiply deprived (that is, exposed to both child specific and basic deprivation) and twice as likely to be in households characterized by basic only deprivation, controlling for other factors controlled,” Watson, D., et al (2012); • Lone parent families are most at risk of poverty.
About Tallaght West • Total population in TW: 29,241 (CSO, 2011); • 16% population increase in last four years, compared to 1.6% nationally; • 7,767 families live in Tallaght West; • 85% of them have at least one child in their family; • High youth population: 32.3% under 14 compared to 21.3% nationally;
About Tallaght West • 30 percent of children experience basic deprivation compared to 23 percent of the total population; • 54% of children in Tallaght West live in lone parent families, compared to the national average of 18.3%; • The total deprivation score 2011 = -11.69, compared to -7 .0 nationally; • The lowest minus value Deprivation Score 2011 in Tallaght west = -23.70 (which is the second most deprived small area in the Country).
About Tallaght West • Unemployment rate among males is 41.3% and females is 27.7% compared to national rates of 22.3% and 15% respectively; • Persons on the Live Register in Tallaght West increased from 4,291 in 2008 to 11,475 in 2013 (167% increase);
Level of Education • 18% of Tallaght West population has primary education only; • 23.3% has lower secondary education (7 years) and 22.5% has upper secondary (11 years); • At the national level these rates are 13.8%, 16.6% and 20% respectively; • Only slightly more than 11% of the population completed education above Bachelor Degree level, compared to 25% nationally.
CDI • One of three areas constituting the Prevention and Early Intervention Programme (PEIP), funded through Government and Philanthropy; • Formally established 2007, after three years of ground work; • Strategy developed and implemented: informed by and in consultation with those living and working in Tallaght West; • 2012 Government announcement to establish area based responses to child poverty, to consolidate the work of the PEIPs. Meeting needs, making changes, improving outcomes.
Two Parallel and Sometimes Conflicting Objectives Meeting needs, making changes, improving outcomes. • To improve outcomes for children and families, and; • To test and create evidence to inform policy and practice through; • Commissioning local service providers; • Designing and delivering seven manualised programmes; • Eight rigorous independent evaluations (seven now published).
CDI Evaluation Methodology 3 Randomised Controlled Trials 3 Process Evaluations Quasi-Experimental Study Healthy School’s Programme – (TCD) Retrospective Impact Study Speech & Language Therapy
DD Secondary Outcomes These secondary outcomes were approaching statistical significance and all were moving in a positive direction.
SLT Findings • International evidence that over 50% of children in disadvantaged communities will require SLT intervention; • Three pronged approach: child, parent and school/early years service; • On-site delivery and ‘scaffolding’ of parents to engage; • Strong potential for Early Years services and schools to identify, and intervene, in the case of children with speech and language needs and to support their families through the therapy process; • At least 18% of children transitioned from the service with normal speech and language limits post-intervention. This finding is particularly positive in the context of multiple disadvantage; • The intervention effectively removed one further risk factor from the lives of a proportion of these children.
SLT Highlights • 39 children referred to other non-SLT specialist services both during intervention and at point of transition, 31% ear nose and throat, 5% psychology, 15% multiple, 18% audiology, 21% assessment of need and 10% other; • Changes in practice developed within the Early Years services and schools in relation to the support of speech and language development; • Improved SLT satisfaction from working in an intensive manner with children, shorter waiting lists and on-site therapy; • Parents: easier access because of the model’s location and non-stigmatizing experience for their child; • Early Years RCT: 85% of intervention children were classified as ‘normal’ on the SDQ Hyperactivity subscale, compared with 78.45% in the control group (teacher-rated); • The more sessions of a parenting course that parents attended, the more beneficial the home learning environment.
Other Highlights: RP • Significant improvement in people’s ability to manage conflict with greatest gains made in interagency work and between neighbours; • Significant improvement in relationships with greatest gains between organisations and their service users; • 87% better management of conflict; • 43% reduction in disputes with greatest gains made in the workplace.
Overall Findings • Parent support works best when formal and informal approaches are combined; • Outcomes for children are maximised when parents participate; • Instinct isn’t enough and children enjoying an intervention doesn’t equate to positive change; • Developing capacity amongst staff is central to any strategy; • Managers ability to support and mentor is critical.
Implementation Challenges Meeting needs, making changes, improving outcomes. • Time lags and collective amnesia; • Getting buy-in to a ‘scientific approach’; • Fear of being de-professionalised in the context of manualised programmes; • Using and creating evidence (outcome data unavailable throughout service delivery); • Creating and supporting change in terms of e.g. ways of working, nature of relationships, etc.
What Helped? Meeting needs, making changes, improving outcomes. • Honesty; • Transparency and communication; • Admitting that we are not the experts; • Good coffee; • Well run meetings; • Humour; • Informal follow-up and connections; • Quick wins; • Documenting everything!
The Essence of a Community Response to Child Poverty • Consultation, collaboration: having a named person responsible for bringing people together; • Identifying need (within existing resources); • Utilising evidence to maximise positive outcomes; • Work with existing services to develop capacity; • Resource change management processes, upskilling, getting buy-in, developing leadership.
References • Central Statistics Office. Census of Population 2006. Dublin: Central Statistics Office, 2006. • Central Statistics Office. Census of Population 2006; 2011. Dublin: Central Statistics Office, 2006/2011. • Childhood Development Initiative. How Are Our Kids? (2004) • Childhood Development Initiative. How Are Our Families? (2010) • Childhood Development Initiative. Quality Services, Better Outcomes (2011) • DOHC. (2008) (www.dohc.ie) cited in Keilthy, C. (2009) Medical Card Eligibility: Profiling People Living in Poverty without a Medical Card using EU – SILC 2006. (CPA) • Watson, D. et al, 2012, Understanding Childhood Deprivation in Ireland, Department of Social Protection and the Economic and Social research Institute, Dublin, Ireland. • www.twcdi.ie • marian@twcdi.ie • NB all seven CDI evaluation reports and eight policy papers are available on our website.
Contact us • www.facebook.com/childhooddevelopmentinitiative • http://twitter.com/twcdi • www.twcdi.ie • info@twcdi.ie