Download
1 / 26
270 likes | 433 Views
IMPRS workshop Comparative Genomics 18 th -21 st of February 2013 Lecture 4. Positive selection. What is positive selection?. Positive selection is selection on a particular trait - and the increased frequency of an allele in a population. Population level

E N D
IMPRS workshop Comparative Genomics 18th-21st of February 2013 Lecture 4 • Positive selection
Positive selection is selection on a particular trait • - and the increased frequency of an allele in a population
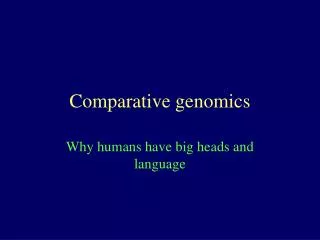
Population level Positive selection can drive the changes in frequencies of two alleles Directional selection Balancing selection Woolhouse et al, 2002. Nat. Genet
Interspecific level Positive selection driving divergence Diversifying positive selection Species B Species C Species A
Why is it interesting to identify traits which • have undergone or are under positive selection? Function Evolution Environment ……
Come from changes in the • nucleotide sequence
Quantifying non-synonymous variation • - an estimate of positive selection Synonymous mutations: neutral mutations Non-synonymous mutations: non-neutral mutations
To measure positive selection: Rate of synonymous mutations Rate of non-synonymous mutations
Positive selectionbetween species Kaor dN Positive selection Neutral evolution f.ex. effector genes f.ex. pseudogenes Purifying selection f.ex. housekeeping genes Ks or dS KA or dN: rate of non-synonymousdivergence KS or dS: rate of synonymousdivergence Evolution betweenspecies
Positive selection in a population PN Positive selection Neutral evolution f.ex. pseudogenes Purifying selection f.ex. housekeeping genes PS PN: rate of non-synonymous polymorphisms PS: rate of synonymous polymorphisms Evolution within species
Estimates of non-synonymous and synonymous polymorphisms and substitutions provide insight into the evolutionary processes Analysingdivergence and polymorphism: • KA/ KS ratios > 1 indicate positive selection • KA / KS ratios < 1 indicate negative selection • KA / KS ratios = 1 indicates neutral evolution dN / dS branch-specific estimate Ka/Ks KAanddN: rate of non-synonymous substitutions KSanddS:rate of synonymous substitutions PN: Amount of non-synonymous polymorphisms PS: Amount of synonymous polymorphisms PN / Ps Species A Species B Species C
Estimates of non-synonymous and synonymous polymorphisms and substitutions provide insight into the evolutionary processes Contrasting divergence and polymorphism: • Ratios of KA/ KS provide insight into the amount of non-synonymous divergence • The branch specific dN / dSratios • are measures of adaptive evolution • particular to one branch dN / dS Ka/Ks PN / Ps • Ratios of PN / PS provide insight into the strength of purifying selection in the species Species A Species B Species C
Basic analyses of the proportion of non-synonymous to synonymous divergence KA/KS • Counts of non-synonymous mutations for each gene (Nd) • Counts of synonymous mutations for each gene (Sd) • Counts of potential non-synonymous sites for each gene (N) • Counts of potential synonymous sites for each gene (S) Non-synonymous substitution rate: KA= Nd / N Synonymous substitution rate: KS= Sd / S Ratio KA/KSas an inidicator of evolutionary mode in each gene Nei and Gojobori, 1986
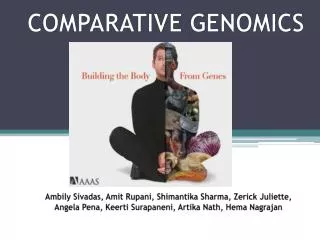
Counts of possiblesynonymous sites for each gene (S) 1 2 3 4 5 Pro PheGlyLeuPhe Seq 1 CCC UUU GGG UUA UUU Seq 2 CCC UUC GAG CUA GUA Pro PheAlaLeu Val Calculate potential synonymous sites (S) for each codon A fourfold degenerate site counts as S = 1 (N = 0) A non-degenerate site counts as S = 0 (N = 1) A two fold degenerate site counts as S = 1/3 (N = 2/3) Proline S = 0 + 0 + 1 = 1 Phenylalanine S = 0 + 0 + 1/3 = 1/3 For Glycine S = 0 + 0 + 1 = 1, for Alanine S = 0 + 0 + 1 = Take the average: S=1 Leucinefor UUA, S = 1/3 + 0 + 1/3 = 2/3 for CUA, S = 1/3 + 0 + 1 = 4/3 Take the average of these: S = 1 for codon 4 Phenylalanine for UUU, S = 1/3 for guanine, S = 1 Take average: S = 2/3 For whole sequence, S = 1 + 1/3 + 1 + 1 + 2/3 = 4 N = total number of sites: S = 15 - 4 = 11
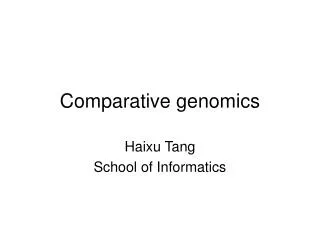
Counts of synonymouschanges 1 2 3 4 5 Pro PheGlyLeuPhe Seq 1 CCC UUU GGG UUA UUU Seq 2 CCC UUC GAG CUA GUA Pro PheAlaLeu Val Calculate Sdand Nd for each codon. 1. Sd = 0, Nd = 0 2. Sd = 1, Nd = 0 3. Sd = 0, Nd = 1 4. Sd = 1, Nd = 0 5. thiscould happen in twoways UUU --> GUU --> GUA Nd = 1 Sd = 1 Route 1: Sd= 1, Nd= 1 UUU --> UUA --> GUA Nd = 1 Nd = 1 Route 2: Sd= 0, Nd= 2 Take average of these two: Sd= 0.5, Nd = 1.5 Total Sd = 2.5 Total Nd = 2.5 Sd/ S = 2.5/4 = 0.625 Nd/ N = 2.5/11 = 0.227 dN/dS = 0.363
Positive selectionbetween species dN Positive selection Neutral evolution f.ex. effector genes f.ex. pseudogenes Purifying selection f.ex. housekeeping genes ds
When positive selection is related to species divergence Contrasting divergence and polymorphism: Ka/Ks PN / Ps Species A Species B Species C
McDonald Kreitman (MK) test to contrast within and between species variation
Drosophila dataset alcohol dehydrogenase Repl: Nonsynonymous, Syn: Synonymous Fixed: Substitution, Poly: Polymorphisms
MK test contrasts within and between species synonymous and non-synonymous differences The proportion of non-synonymous fixed differences between species much higher than the proportion of non-synonymous polymorphisms Contingency table can be tested by a G-test
Conclusion from MK-test: Adh locus in Drosophila has accumulated adaptive mutations (been under positive selection) when the Drosophila species diverged
One problem with the “counting methods” Sometimes the signal of selection is not very strong
Positive selection on one or fewparticularcodons or in oneparticularbranch Evolutionary model to detect selection in particular codons or branches