Download

1 / 9
130 likes | 377 Views
Land Use/Land Cover Data Project. Planning Team – March 9-10. Land Use/Land Cover Data Issues. Dated information – some as old as the mid-80s Different data needs for various applications

E N D
Land Use/Land Cover Data Project Planning Team – March 9-10
Land Use/Land Cover Data Issues • Dated information – some as old as the mid-80s • Different data needs for various applications • Inconsistent quality and resolution used in various emissions estimation tools used for regional haze planning • Fire • Dust • Biogenics • Fugitive ammonia • Windblown dust
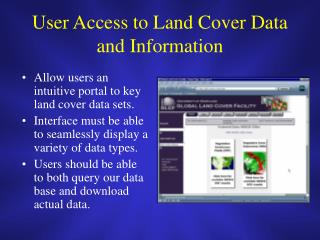
Applications of Land Use/Land Cover Data for Planning Purposes • Emissions Tracking and Management • Dust • Fire • Context for “painting the Reasonable Progress picture” • Emissions data resolution • Area vs. Point for regulatory purposes • Near Class I areas Emissions Characterization • Dovetail into Technical Data Portal project • Technical Uses • Emissions modeling • Windblown dust • Fugitive Ammonia • Biogenics
Deliverables - Land Use/Land Cover Data Project • April - catalogue available data, prepare complete listing of available data for WRAP region • May - evaluate data for use in emissions estimation technical tools, recommend changes, annotate catalogue above • June - process data into tools • June - final website report on project
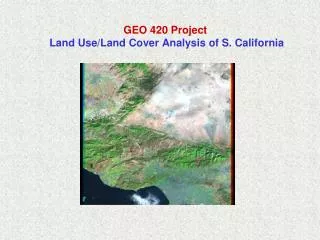
GIS Data Evaluation • Spatial Resolution • Need to balance increased resolution with processing requirements/resources • Depends on expected uses of data sets • Note data in Figure 4 is derived from Figure 3 data by re-sampling to 2-km resolution – Loss in spatial detail/resolution • Temporal Changes • Landuse changes over time • Relevance for urban areas; desert/barren lands; Ag lands; coastal areas • Note yellow areas in NE regions and at S end of Bay. Between 1986 and 1993 these are increased areas of barren lands – Possibly due to increased construction activity (urban sprawl) • Attribute classification • Data classifications for specific uses • More detailed categories (wetlands, urban lands) • Trade-offs between desired resolution/attributes and available resources/data uses
Figure 4. 1993 LU Data (NLCD) As gridded for WRAP Analyses