Download
1 / 23
230 likes | 251 Views
Learn about the research topics, measurement facilities, and experiments conducted in the Fluid Mechanics & Heat Transfer laboratory at Tampere University of Technology's Department of Energy and Process Engineering.

E N D
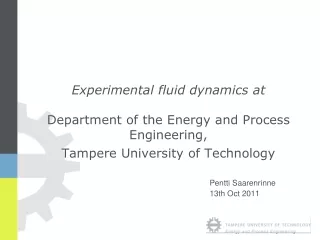
Experimental fluid dynamics at Department of the Energy and Process Engineering, Tampere University of Technology Pentti Saarenrinne 13th Oct 2011
Dept. of Energy and Process Engineering Figures • Budget 3,6 M€ (1,7 +1,9 M€) • 7 professors • 30 researchers & research assistants • 6 technicians Research topics • Fluid Mechanics & Heat Transfer (CFD & Experimental) • Paper converting and packaging • Refrigeration Technology • Combustion & Power Plant Technology
The EFD group The group is specialized in optical measurement techniques in fluid mechanics and their adaptation to multi- phase flows. Other research topics include turbulence, fluid-structure interactions, flow control, and mixing. The team: • Pentti Saarenrinne, Professor, D. Sc. (Tech) • Hannu Eloranta, D. Sc. (Tech.) moved to Pixact Ltd • Markus Honkanen, D. Sc. (Tech.) • Maria Putkiranta, M.Sc. (maternity leave) + M.Sc. students
Measurement facilities For single-phase flows • PIV (three systems, including high-speed SPIV) • LDA For multi-phase flows • Direct imaging (high-speed & others) • PDA The laboratory has several water circulation loops, mixing tanks… Paper converting laboratory • Pilot plant (1 m width) • Laboratory
Fiber suspension flows Simultaneous PIV and DI in a dilute fiber suspension flow
Fiber suspension flows Simultaneous PIV and DI in a dilute fiber suspension flow
Fiber orientation and flocculation measurements Experiments are conducted…
Fiber orientation measurements The effect of fiber consistency... C=0.02%-w C=0.1%-w C=0.5%-w
The flocculation experiments Pine, 0.5%-w (mean length: 2.3mm, crowding factor: ~60) Two flow rates: 2.25 l/s (Uexit=5.0m/s) and 4.00 l/s (Uexit=8.5m/s) Two channels • • •
Data collection Images of the fiber phase were collected with two back- lighting systems: • Double-frame camera operating at 4 Hz • High-speed camera operating at 1000-4000 Hz •
Bubble analysis with 3D orthogonal imaging • Rising bubbles, frame rate 1000 1/s . • Orthogonal projections of the flow was achieved with a mirror system. • Automatic image analysis recognises bubbles, even when they are overlapping. .
Ink removal from recirculated pulp suspension - Measurements in a flotation tank Submerged probe for the bubble size distribution in the inlet jet. - Image analysis
Air removal from fiber suspension in an open channel flow •Bubble movement in a fiber suspension. •Blue broken lines are bubble path lines. • Submerged measurement device sinking in suspension .
The strain distributions inside a year ring during sudden compression in a split-Hopkinson device Objectives: • To develop an imaging and illumination method for the phenomena • The preparation of the wood samples to enable the measurement of the deformation inside a year ring • Measurement were made at elevated temperatures in a closed split- Hopkinson device at Mid-Sweden University (Sundsvall).
The strain distributions inside a year ring in sudden compression /2 With frame rate 50 000 1/s was imaged in one Compression a serie of 12 images. Results: • From the deformation images was computed strain maps. • The year rings of the sample are on the right hand side of the large strain areas. • The deformation in the ”spring” wood is bigger
A Laboratory Scale CFB H x W x D: 3.0 x 0.4 x 0.015 m. Cold model. Fluidization velocities up to 4.0 m/s. Sauter mean diameters: 442 μm or 255 μm. •Particle size distribution was measured with shadowgraphy:
High speed imaging at the bottom part of the model Frame rate300Hz Red arrow, velocity upwards 5 m/s, Blue arrow same velocity downwards testi image nr. 0 0 2.1 4.2 6.3 8.4 y [mm] 10.5 12.6 14.6 16.7 18.8 0 4.2 8.4 12.6 16.7 20.9 25.1 x [mm] testi-f16 image nr. 1 0 5 10 y [mm] 15 20.1 0 10 20.1 30.1 40.1 50.2 60.2 x [mm]