Capacity and Demand
Capacity and Demand. Lecture 16 CE 2710 Norman Garrick. AADT versus Design Hour Volume. Design Hour Volume Often reports from state level traffic count studies give average annual daily traffic (AADT )

Capacity and Demand
E N D
Presentation Transcript
Capacity and Demand Lecture 16 CE 2710 Norman Garrick
AADT versus Design Hour Volume Design Hour Volume Often reports from state level traffic count studies give average annual daily traffic (AADT) But we don’t use AADT for design, we need to get a design hour that correspond to a relatively busy hour of the day The hour selected for design is referred to as the design hour What hour should be selected? Generally we select an hour that is any where from the 30th to the 100th busiest hour of the year As a very rough guide the typical design hour volume is can be taken as about 10% of the AADT. But this % varies significantly depending on the temporal variation in traffic. Once a design hour volume is determined then the designer must also determine the directional split at that hour Norman W. Garrick
Estimating Design Hour Volume from AADT Norman W. Garrick
Demand and Capacity for Street and Highway Design Convention street and highway design is based on the idea of fitting capacity to demand Demand is characterized by a design hour volume Capacity is characterized by design hourly service volume Norman W. Garrick
Demand The design hour volume is meant to be the volume of traffic that will use the facility in the design hour, in the design direction, in the design year Usually the design hour is taken as the 30 busiest hour of the year DHV is often estimated from AADT Norman W. Garrick
Estimating Traffic in the Design Year In many projects, the DHV is based on traffic for 20 or 30 years in the future The procedure for doing this is some times derided as ‘predict and provide’ because in many cases it is based just on predicting past trends Norman W. Garrick
Problems with Predict and Provide Predict and provide is problematic because expanding capacity affects future demand. Providing increase capacity lead to more traffic volumes in the future than we would otherwise have. Over the last 60 years this has lead to a self re-enforcing cycle of increasing traffic. But, recent trends suggest that this cycle might be at an end. Norman W. Garrick
Traffic Trends in USA Norman W. Garrick
Traffic Trends in ConnecticutRoute 195 Data Norman W. Garrick
Predict and Provide in an Era of Decreasing Traffic Decreasing or steady traffic volumes is one more reason to reject the concept of predict and provide Basing design decisions on a 20 or 30 year prediction of traffic volume is increasingly unacceptable Norman W. Garrick
Consequences of Decreasing Traffic http://articles.philly.com/2014-03-10/news/48055048_1_bridge-traffic-turnpike-traffic-pennsylvania-turnpike-commission Before beginning a $2.5 billion project to widen the New Jersey Turnpike, turnpike officials said the construction was necessary to reduce existing congestion and to cope with future traffic. "Turnpike traffic is on the rise," the state Turnpike Authority said in its justification for the project. "By 2032 northbound traffic volume is expected to increase by nearly 68 percent [above 2005 levels]; southbound traffic is forecasted to increase by 92 percent.” Now, one-third of the way through that 27-year forecast, turnpike traffic is actually about 10 percent lower than it was in 2005. man W. Garrick
CapacityHow is the capacity of the Hoover Dam Determined? Norman W. Garrick
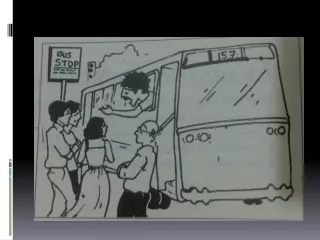
What is the Capacity of a Street? Norman W. Garrick
Understanding Capacity for Vehicle Travel The designer has flexibility in selecting a design capacity She does this by designating a Level of Service Once a LOS is determined then the design hourly service volume can be selected from a chart Determining vehicle capacity on a street is not really like determining the amount of water in a measuring jar Capacity is not a fixed number – it is rather a number selected based on what level of congestion we are willing to put up with Norman W. Garrick
LOS for FreewaysLOS in urban areas is usually based on intersection flow Norman W. Garrick
Capacity and the Level of Service What are the trade-offs involved in selecting a low LOS? Norman W. Garrick
Capacity and the Level of Service Some cities now require that we design for LOS E or F to reduce inefficiency and the impact on the urban area of having large facilities Selecting a low LOS means that you are designing for a low level of congestion during the busiest hour of the year That means the facility will be empty for most hours in the day Norman W. Garrick
What is the Capacity of this Street? Norman W. Garrick
New View of Street Capacity In the past, Street Capacity = Design Hour Service Volume Now, Street Capacity = Social Capacity + Economic Capacity + Travel Capacity By Ian Lockwood Norman W. Garrick
Design Hour Volume Calculation A new urban street is estimated to have a ADT of 15,000 vehicles per day. The directional split is 60% to 40% in the peak direction. The distribution of traffic for each hour in the year is given below Solution: Use 30th hour as design hour % of AADT in 30th hour = 8.6% from graph Traffic flow in design hour in both direction = 0.086*15000 = 1290 Design Hour Volume in peak direction = 1290 * 0.6 = 774
Traffic Hourly Distribution Hour volume as % of ADT Number of Hours with traffic great than shown
Number of Lanes A new urban street is estimated to have a ADT of 20,000 vehicles per day. The directional split is 60% to 40% in the peak direction. Determine number of lanes at a Level of Service of E Solution: Design Hour Volume in peak direction = 1290 * 0.6 = 774 Estimated Capacity for Level of Service E (the Design Hour Service Volume) = 820 vehicles / hour / lane (from a chart) Number of lanes needed = DHV/DHSV = 0.97 Need one lane in each direction