Download
1 / 30
300 likes | 320 Views
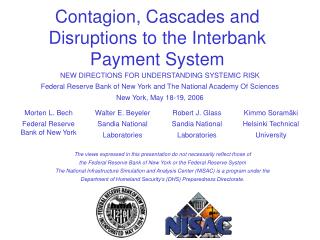
This research explores the network topology of interbank payment flows and builds an agent-based model to evaluate the response of payment systems to shocks and the possibility of cascading failures.

E N D
Contagion, Cascades and Disruptions to the Interbank Payment System NEW DIRECTIONS FOR UNDERSTANDING SYSTEMIC RISK Federal Reserve Bank of New York and The National Academy Of Sciences New York, May 18-19, 2006 The views expressed in this presentation do not necessarily reflect those of the Federal Reserve Bank of New York or the Federal Reserve System The National Infrastructure Simulation and Analysis Center (NISAC) is a program under the Department of Homeland Security’s (DHS) Preparedness Directorate.
The Big Picture Complex, Adaptive System central bank clearing and settlement financial markets markets for goods and services
central bank clearing and settlement financial markets markets for goods andservices
Primer on Interbank Payment System Federal Reserve - bank of banks Max day = 800,000 payments worth $2.9 trillion Turnover = US GDP every six business days Fedwire Large-value, time-critical payments Real Time Gross Settlement (RTGS) system Fed provides intraday credit for a fee other infrastructures bank i bank j markets 7600 participants
A Break Down in Coordination ¯ McAndrews and Potter (2002)
The Intraday Liquidity Management Game Fee F charged by central bank for overdrafts F < D Total cost = 0 (FIRST BEST) Stag Hunt F > D Time is money (also intraday) so delay is costly. The cost is D > 0 per dollar Total cost = 0 or (6) Rational players are pulled in one direction by considerations of mutual benefit and in the other by considerations of personal risk
Adjustment following Wide-Scale Disruption F < D Liquidity cheap relative to delaying F = D F = 2D Potential D < F< 2D F = 2D Liquidity expensive relative to delaying F > 2D Share of banks hit by disruption / holding back payments
Heterogeneous Banking Sector Large bank not affected Potential Large bank affected Share of banks hit by disruption / holding back payments
Network Topology of Payment Flow Large bank not affected Potential Large bank affected
Research Goals • Evaluate the actual network topology of interbank payment flows through analysis of Fedwire transaction data • Build a parsimonious agent based model for payment systems that honors network topology • Evaluate response of payment systems to shocks and the possibility of cascading failure
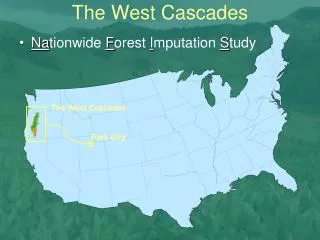
Network Topology after 9/11 Fedwire’s Core
All Commercial Banks >6600 nodes, 70,000 links
Network Components GWCC Tube Tendril DC GIN GSCC GOUT 12% 78% nodes 8% • GSSC Dominates • 78% nodes • 90% edges • 92% transfers • 90% value
Structure Behavior • Perhaps Switch Between the Two with Morten Animation Magic
Research Goals • Evaluate the actual network topology of interbank payment flows through analysis of Fedwire transaction data • Build a parsimonious agent based model for payment systems that honors network topology • Evaluate response of payment systems to shocks and the possibility of cascading failure
Payment Physics Model 4 Payment account is debited 5 Payment account is credited Bi Bj 6 Depositor account is credited 3 Payment is settled or queued Qi Bi > 0 Di Dj Qj > 0 Qj 7 Queued payment, if any, is released 1 Agent instructs bank to send a payment Productive Agent Productive Agent Central bank Payment system Liquidity Market Bank i Bank i 2 Depositor account is debited
Influence of Liquidity Payment System Instructions Payments Liquidity Summed over the network, instructions arrive at a steady rate When liquidity is high payments are submitted promptly and banks process payments independently of each other
Influence of Liquidity Payment System Instructions Payments Liquidity Reducing liquidity leads to episodes of congestion when queues build, and cascades of settlement activity when incoming payments allow banks to work off queues. Payment processing becomes coupled across the network 1 1
Influence of Liquidity Payment System Instructions Payments Liquidity 1 At very low liquidity payments are controlled by internal dynamics. Settlement cascades are larger and can pass through the same bank numerous times 1
Influence of Market Payment System Instructions Payments Liquidity Market A liquidity market substantially reduces congestion using only a small fraction (e.g. 2%) of payment-driven flow
Research Goals • Evaluate the actual network topology of interbank payment flows through analysis of Fedwire transaction data • Build a parsimonious agent based model for payment systems that honors network topology • Evaluate response of payment systems to shocks and the possibility of cascading failure
Disruption of a bank creates a liquidity sink in the system Disruptions to liquidity market represented as decreased conductance Period of Disruption Period of Disruption Period of Disruption Period of Disruption System throughput can be rapidly degraded Queues build; system becomes increasingly congested; recovery quickly follows restoration Ongoing Disruption Analyses
What we’re learned • Payment system participants have learned to coordinate their activities, and this coordination can be re-established after massive disruption • Payment flows, like many other networks, follow a scale-free distribution • Performance is a function of both topology and behavior – neither factor alone is enough to evaluate robustness • Liquidity limits can lead to congestion and a deterioration of throughput, but a shift in behavior is evidently needed to understand responses to disruption • System performance can be greatly improved by moving small amounts of liquidity to the places where it’s needed • Collaboration among researches with different backgrounds helps bring new theoretical perspectives to real problems, and helps shape theoretical development to practical ends
Next steps • Intraday analysis of network topology – • How does it get built? • Over what time scales do banks manage liquidity? • Are there discernable behavioral modes (e.g. early/late settlement) or triggers (e.g. settlement of market transactions)? • Long-term network dynamics (e.g. changes in TARGET topology with integration) • Disruption/recovery behavior of simple model, including a central bank • Adaptation of decision process, including market participation, to minimize cost (ongoing). • How is cooperative behavior established and maintained? • How might it be disrupted, restored, through institutions’ policies and reactions? • Modeling the processes that drive payment flows (banks’ and customer investments, market movements, etc.) to: • introduce plausible correlations and other structure on the payment instruction stream • explore the feedbacks between payment system disruptions and the economy