Download
1 / 24
240 likes | 523 Views
Bloodless Glucose Monitor. Presented by: Nelson Wu Team Members: Cong Zhang and Tom Zhou Client: Dr. Jeffrey Brooks, D.P.M. Need. Diabetes mellitus attributed to malfunction of insulin production, a molecule that regulates blood glucose concentrations within the body

E N D
Bloodless Glucose Monitor Presented by: Nelson Wu Team Members: Cong Zhang and Tom Zhou Client: Dr. Jeffrey Brooks, D.P.M.
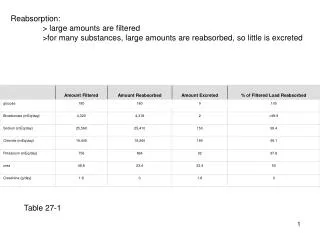
Need • Diabetes mellitus attributed to malfunction of insulin production, a molecule that regulates blood glucose concentrations within the body • Normal glucose level: 70 to 110 mg/dL • Blood glucose spike to 180 mg/dL after meals • Normally brought back down by insulin • Stay high for 3 hours for people with diabetes
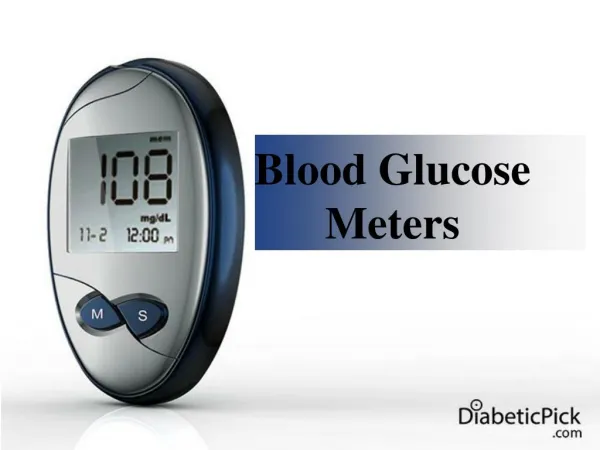
Finger Prick- The Gold Standard • Performs glucose oxidation and measures changes in sample • Costs approximately $1000 per year in test strips • Requires puncturing the skin which often results in neuropathy • Patient is only willing to puncture skin so many times per day, limiting effectiveness of monitoring
Specific Design Requirements • Device does not require implanted parts or physically puncturing the user • Device gives results in a reasonable time frame (within 1 minute) • Device displays blood glucose in standard units (mg glucose/dL blood) • Device warns user on detection of dangerous glucose levels (>200mg/dL or <70mg/dL) • Device is lighter than 20 N and smaller than 200 cm3 • Device contains internal power for one month of testing (10 W-hr) • Device is accurate within 10% of the commercially-available methods at least 95% of the time
Design Possibilities • Reverse Iontophoresis • Photoacoustic Effect • Optical Coherence Tomography • Multispectral Polarimetry • Near-Infrared Spectroscopy • Raman Spectroscopy
Reverse Iontophoresis • Extracting glucose in fluid drawn from skin using electrical current • Example: G2 Glucowatch, US patent 20080058627 • Causes skin irritation • Requires daily “finger-prick” calibration • Disrupted by sweating
PhotoacousticEffect • Use laser pulse to heat tissue • Measure thermal tissue expansion and acoustic wave • Calculate fluid viscosity and correlative glucose concentration • Not affected by water itself due to poor response • Fluid viscosity confounded
Multispectral Polarimetry • Measures the intensity of collected polarized light. • Requires low turbidity (i.e. aqueous humor of the eye) • Unaffected by temperature and pH • Time lag
Optical Coherence Tomography • Based on the delay of backscattered light compared to the light reflected by the reference arm mirror • High resolution two-dimensional images by in-depth and lateral scanning • Twenty minute lag from blood glucose levels • The refractive index of the interstitial fluid increases in response to increase in its glucose concentration • Sensitive to motion artifacts and changes in skin temperature
Near Infrared Spectroscopy Raman Spectroscopy • Measures elastic scattering of light • Strong Water Spectrum • 785 nm for 1 mm tissue penetration • Weak tissue autofluorescence • Less photodamage • Measures inelastic scattering of light • Weak Water Spectrum • 785 nm for 1mm tissue penetration • Weak tissue autofluorescence • Less photodamage
Raman Spectroscopy • 785 nm incident • 861 nm Glucose • 893 nmhemoglobin
Overview Invasive: Blood pricking method Reverse Iontophoresis Indirect: Photoacoustic Effect Non-invasive Monitor location: Eye Multispectral Polarimetry Direct Monitor location: Skin Interstitial Space: Optical Coherence Tomography Capillaries Elastic: NIR Spectroscopy Inelastic: Raman Spectroscopy
Specific Details of Chosen Design • Optical Elements • Laser source • Beam splitters • Objective and focusing lens • Bandpassfilters • Photodetectors • Non-Optical Elements • Data acquisition (DAQ) analogue to digital converter (ADC) • Computation circuit board • Display • Battery • Case
Laser source • QL7816S-B-L • 785 nm, 25 mW, Ø5.6 mm, B Pin Code Laser Diode • The laser diode provides a single wavelength light source • A single wavelength light source is preferable to a source of a broad range of wavelengths • As the spectral peaks of glucose and hemoglobin are relative to wavelength of the simulation laser, broader simulation sources will result in broader spectral peaks.
Collimating Lens • LT220P-B • Collimation Tube with Optic for Ø5.6 and Ø9 mm Laser Diodes, f = 11.0 mm • Converts the diverging light from the laser diode to parallel laser light, needed to progress through preceding optical elements • The main consideration of the collimation tube is the width of output collimated light • A width too narrow is prone to optical misalignment whereas a width too wide increases the sizes of optical elements requires
Beam splitters • BS011 • 50:50 Non-Polarizing Beamsplitter Cube, 700-1100 nm, 10 mm • The main considerations for the beam splitters is the ratio of light intensity between the split. This ratio determines how much of the incoming light will be transmitted through the cube versus deflected 90 degrees.
Objective (focusing) lens • C240TME-B • f = 8.0 mm, NA = 0.5, Mounted Geltech Aspheric Lens, AR: 600-1050 nm • The objective lens is used to focus the collimated laser light to a focused spot in the skin, and to capture and collimate the backscattered Raman signal. • The lens must also focus the laser light to a point on a blood vessel near the surface of the skin, as the optical penetration depth at 785 nm is around 1 mm in tissue.
Bandpassfilters • Hemoglobin Bandpass filter: FB890-10 • Ø1in Bandpass Filter, CWL = 890 ± 2 nm, FWHM = 10 ± 2 nm • Glucose bandpass filter: FB860-10 • Ø1in Bandpass Filter, CWL = 860 ± 2 nm, FWHM = 10 ± 2 nm
Photodetectors • FDS100 • Si Photodiode, 10 ns Rise Time, 350 - 1100 nm, 3.6 mm x 3.6 mm Active Area • The photodetector outputs a current indicative of measured light intensity. • Two photodetectors are used in the device: one to measure the intensity of the glucose peak, the other to measure the intensity of the hemoglobin peak.
Updated Team Responsibilities • Nelson Wu • Contact for Client • Website Moderator • Knowledge on alternative spectroscopies • Cong Zhang • Knowledge on Optical Components • Knowledge on Raman Spectroscopy • Tom Zhou • Knowledge on Non-Optical Components • Programmer
References • 1. Kong et al. “Clinical Feasibility of Raman Spectroscopy for Quantitative Blood Glucose Measurement.” Massachusetts Institute of Technology. 2011. • 2. Larin, K. V., M. S. Eledrisi, M. Motamedi, and R. O. Esenaliev. "Noninvasive Blood Glucose Monitoring With Optical Coherence Tomography: A Pilot Study In Human Subjects ." Diabetes Care 25.12 (2002): 2263-2267. Print. • 3. N.D. Evans, L. Gnudi, O. J. Rolinski, D. J. S. Birch, and J. C. Pickup. “Non-invasive glucose monitoring by NAD(P)H Autofluorescence spectroscopy in broblasts and adipocytes:a model for skin glucose sensing.” Diabetes Technology and Therapeutics 5 (2003): 807-816. Print. • 4. Pishko, Michael V.. "Analysis: Glucose Monitoring By Reverse Iontophoresis." Diabetes Technology Therapeutics 2.2 (2000): 209-210. Print. • 5. Plaitez, Miguel, Tobias Leiblein, and Alexander Bauer. "In Vivo Noninvasive Monitoring of Glucose Concentration in Human Epidermis by Mid-Infrared Pulsed Photoacoustic Spectroscopy." Analytical Chemistry 85.2 (2013): 1013-1020. Print. • 6. Potts, Russel, Janet Tamada, and MichealTearny. "Glucose monitoring by reverse iontophoresis." Diabetes/metabolism research and reviews 18 (2002): 49-53. Print. • 7. Shao et al. “In Vivo Blood Glucose Quantification Using Raman Spectroscopy.” Fuzhou University. 2012. • 8. Thenadil, Suresh, and Jessica Rennert. "Comparison of Glucose Concentration in Interstitial Fluid, and Capillary and Venous Blood During Rapid Changes in Blood Glucose Levels." Diabetes Technology & Therapeutics 3.3 (2004): 357-365. Print. • 9. Whiting, D., Weil, C., & Shaw, J. (2011). IDF Diabetes Atlas: Global estimates of the prevalence of diabetes for 2011 and 2030. Diabetes Research and Clinical Practice, 94(3), 311-321. • 10. Vashist, Sandeep. "Non-invasive glucose monitoring technology in diabetes management: A review." AnalyticaChimicaActa 750 (2012): 16-27. Print. • 11. Yang, Chaoshin, Chiawei Chang, and Jenshinn Lin. "A Comparison between Venous and Finger-Prick Blood Sampling on Values of Blood Glucose." International Conference on Nutrition and Food Sciences 39 (2012): 207-210. Print. • 12. Zhang, Ping, Xinzhi Zhang, and Jonathan Brown. "Global healthcare expenditure on diabetes for 2010 and 2030." Diabetes Research and Clinical Practice 87.3 (2010): 293-301. Print.