Download
1 / 60
600 likes | 696 Views
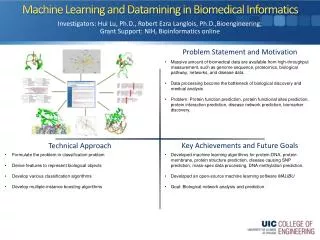
Machine Learning in BioMedical Informatics. SCE 5095: Special Topics Course Instructor: Jinbo Bi Computer Science and Engineering Dept. Course Information. Instructor: Dr. Jinbo Bi Office: ITEB 233 Phone: 860-486-1458 Email: jinbo@engr.uconn.edu

E N D
Machine Learning in BioMedical Informatics SCE 5095: Special Topics Course Instructor: Jinbo Bi Computer Science and Engineering Dept.
Course Information • Instructor: Dr. Jinbo Bi • Office: ITEB 233 • Phone: 860-486-1458 • Email:jinbo@engr.uconn.edu • Web: http://www.engr.uconn.edu/~jinbo/ • Time: Tue/ Thur. 3:30pm – 4:45pm • Location: ITEB127 • Office hours: Tue/Thur 4:45-5:15pm • HuskyCT • http://learn.uconn.edu • Login with your NetID and password • Illustration
Introduction of the instructor and TA • Ph.D in Mathematics • Research interests: machine learning, data mining, optimization, biomedical informatics, bioinformatics • TA • Jingyuan Zhang – graduate student in my lab who has done some machine learning work previously subtyping GWAS Color of flowers Cancer, Psychiatric disorders, … http://labhealthinfo.uconn.edu/EasyBreathing
Course Information • Prerequisite: Basics of linear algebra, calculus, optimization and basics of programming • Course textbook (not required): • Introduction to Data Mining(2005) by Pang-Ning Tan, Michael Steinbach, Vipin Kumar • Pattern Recognition and Machine Learning (2006) Christopher M. Bishop • Pattern Classification (2nd edition, 2000) Richard O. Duda, Peter E. Hart and David G. Stork • Additional class notes and copied materials will be given • Reading material links will be provided
Course Information • Objectives: • Introduce students knowledge about the basic concepts of machine learning and the state-of-the-art machine learning algorithms • Focus on some high-demanding medical informatics problems with hands-on experience of applying data mining techniques • Format: • Lectures, Micro teaching assignment, Quizes, A term project
Grading • Micro teaching assignment (1): 20% • In-class/In-lab open-book open notes quizzes (3): 30% • Term Project (1): 40% • Lab assignment (1): 10% • Lab assignment will not be graded, and it accounts for a warm-up exercise. As long as you turn it in, you will get 10%
Policy • Computers • Participation in micro-teaching sessions is very important, and itself accounts for 50% of the credits for micro-teaching assignment • Quizzes are graded by our teaching assistant with guidance from instructor • Final term projects will be graded by the instructor • If you miss a quiz, there will be a take-home quiz to make up the credits
Micro-teaching sessions • Students in our class need to form THREE roughly-even study groups • The instructor will help to balance off the study groups • Each study group will be responsible of teaching one specific topic chosen from the following: • Support Vector Machines • Spectral Clustering • Boosting (PAC learning model)
Term Project • Possible project topics will be provided as links, students are encouraged to propose their own • Teams of 1-3students can be created • Each team needs to give two presentations: a progress report presentation (10-15min); a final presentation in the last week(15-20min) • Each team needs to submit a project report • Definition of the problem • Data mining approaches used to solve the problem • Computational results • Conclusion (success or failure)
Machine Learning / Data Mining • Data mining (sometimes called data or knowledge discovery) is the process of analyzing data from different perspectives and summarizing it into useful information • http://www.kdd.org/kdd2013/ ACM SIGKDD conference • The ultimate goal of machine learning is the creation and understanding of machine intelligence • http://icml.cc/2013/ ICML conference • The main goal of statistical learning theory is to provide a framework for studying the problem of inference, that is of gaining knowledge, making predictions, and decisions from a set of data. • http://nips.cc/Conferences/2012/ NIPS conference
Traditional Topics in Data Mining /AI • Fuzzy set and fuzzy logic • Fuzzy if-then rules • Evolutionary computation • Genetic algorithms • Evolutionary strategies • Artificial neural networks • Back propagation network (supervised learning) • Self-organization network (unsupervised learning, will not be covered)
Challenges in traditional techniques • Lack theoretical analysis about the behavior of the algorithms • Traditional Techniquesmay be unsuitable due to • Enormity of data • High dimensionality of data • Heterogeneous, distributed nature of data Statistics/AI Machine Learning/ Pattern Recognition Soft Computing
Recent Topics in Data Mining • Supervised learning such as classification and regression • Support vector machines • Regularized least squares • Fisher discriminant analysis (LDA) • Graphical models (Bayesian nets) • Boosting algorithms Draw from Machine Learning domains
Recent Topics in Data Mining • Unsupervised learning such as clustering • K-means • Gaussian mixture models • Hierarchical clustering • Graph based clustering (spectral clustering) • Dimension reduction • Feature selection • Compact feature space into low-dimensional space (principal component analysis)
Statistical Behavior • Many perspectives to analyze how the algorithm handles uncertainty • Simple examples: • Consistency analysis • Learning bounds (upper bound on test error of the constructed model or solution) • “Statistical” not “deterministic” • With probability p, the upper bound holds P( > p) <= Upper_bound
Tasks may be in Data Mining • Prediction tasks (supervised problem) • Use some variables to predict unknown or future values of other variables. • Description tasks (unsupervised problem) • Find human-interpretable patterns that describe the data. From [Fayyad, et.al.] Advances in Knowledge Discovery and Data Mining, 1996
Classification: Definition • Given a collection of examples (training set ) • Each example contains a set of attributes, one of the attributes is the class. • Find a model for class attribute as a function of the values of other attributes. • Goal: previously unseen examples should be assigned a class as accurately as possible. • A test set is used to determine the accuracy of the model. Usually, the given data set is divided into training and test sets, with training set used to build the model and test set used to validate it.
Test Set Model Classification Example categorical categorical continuous class Learn Classifier Training Set
Classification: Application 1 • High Risky Patient Detection • Goal: Predict if a patient will suffer major complication after a surgery procedure • Approach: • Use patients vital signs before and after surgical operation. • Heart Rate, Respiratory Rate, etc. • Monitor patients by expert medical professionals to label which patient has complication, which has not. • Learn a model for the class of the after-surgery risk. • Use this model to detect potential high-risk patients for a particular surgical procedure
Classification: Application 2 • Face recognition • Goal: Predict the identity of a face image • Approach: • Align all images to derive the features • Model the class (identity) based on these features
Classification: Application 3 • Cancer Detection • Goal: To predict class (cancer or normal) of a sample (person), based on the microarray gene expression data • Approach: • Use expression levels of all genes as the features • Label each example as cancer or normal • Learn a model for the class of all samples
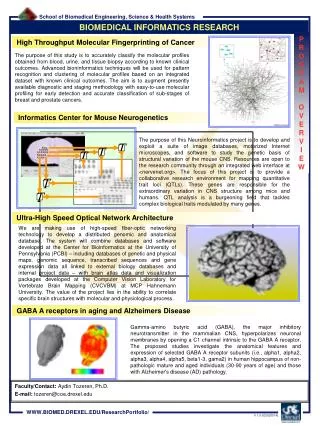
Classification: Application 4 • Alzheimer's Disease Detection • Goal: To predict class (AD or normal) of a sample (person), based on neuroimaging data such as MRI and PET • Approach: • Extract features from neuroimages • Label each example as AD or normal • Learn a model for the class of all samples Reduced gray matter volume (colored areas) detected by MRI voxel-based morphometry in AD patients compared to normal healthy controls.
Regression • Predict a value of a real-valued variable based on the values of other variables, assuming a linear or nonlinear model of dependency. • Extensively studied in statistics, neural network fields. • Find a modelto predict the dependent variable as a function of the values of independent variables. • Goal: previously unseen examples should be predicted as accurately as possible. • A test set is used to determine the accuracy of the model. Usually, the given data set is divided into training and test sets, with training set used to build the model and test set used to validate it.
Refund Marital Taxable Tid Loss Status Income 100 1 Yes Single 125K 120 2 No Married 100K -200 3 No Single 70K -300 4 Yes Married 120K -400 5 No Divorced 95K -500 6 No Married 60K -190 7 Yes Divorced 220K 300 8 No Single 85K Test Set -240 9 No Married 75K Model 90 10 No Single 90K 10 Regression application 1 Continuous target categorical categorical continuous Current data, want to use the model to predict Learn Regressor Training Set Past transaction records, label them goals: Predict the possible loss from a customer
Regression applications • Examples: • Predicting sales amounts of new product based on advertising expenditure. • Predicting wind velocities as a function of temperature, humidity, air pressure, etc. • Time series prediction of stock market indices.
Clustering Definition • Given a set of data points, each having a set of attributes, and a similarity measure among them, find clusters such that • Data points in one cluster are more similar to one another. • Data points in separate clusters are less similar to one another. • Similarity Measures: • Euclidean Distance if attributes are continuous. • Other Problem-specific Measures
Illustrating Clustering • Euclidean Distance Based Clustering in 3-D space. Intracluster distances are minimized Intercluster distances are maximized
Clustering: Application 1 • High Risky Patient Detection • Goal: Predict if a patient will suffer major complication after a surgery procedure • Approach: • Use patients vital signs before and after surgical operation. • Heart Rate, Respiratory Rate, etc. • Find patients whose symptoms are dissimilar from most of other patients.
Clustering: Application 2 • Document Clustering: • Goal: To find groups of documents that are similar to each other based on the important terms appearing in them. • Approach: To identify frequently occurring terms in each document. Form a similarity measure based on the frequencies of different terms. Use it to cluster. • Gain: Information Retrieval can utilize the clusters to relate a new document or search term to clustered documents.
Illustrating Document Clustering • Clustering Points: 3204 Articles of Los Angeles Times. • Similarity Measure: How many words are common in these documents (after some word filtering).
Classification algorithms • K-Nearest-Neighbor classifiers • Naïve Bayes classifier • Neural Networks • Linear Discriminant Analysis (LDA) • Support Vector Machines (SVM) • Decision Trees • Logistic Regression • Graphical models
Regression methods • Linear Regression • Ridge Regression • LASSO – Least Absolute Shrinkage and Selection Operator • Neural Networks
Clustering algorithms • K-Means • Hierarchical clustering • Graph-based clustering (Spectral clustering) • Semi-supervised clustering • Others
Challenges of Data Mining • Scalability • Dimensionality • Complex and Heterogeneous Data • Data Quality • Data Ownership and Distribution • Privacy Preservation
Basics of probability • An experiment (random variable) is a well-defined process with observable outcomes. • The set or collection of all outcomes of an experiment is called the sample space, S. • An event E is any subset of outcomes from S. • Probability of an event, P(E) is P(E) = number of outcomes in E / number of outcomes in S.
ProbabilityTheory Apples and Oranges X: identity of the fruit Y: identity of the box Assume P(Y=r) = 40%, P(Y=b) = 60% (prior) P(X=a|Y=r) = 2/8 = 25% P(X=o|Y=r) = 6/8 = 75% P(X=a|Y=b) = 3/4 = 75% P(X=o|Y=b) = 1/4 = 25% Marginal P(X=a) = 11/20, P(X=o) = 9/20 Posterior P(Y=r|X=o) = 2/3 P(Y=b|X=o) = 1/3
Probability Theory • Marginal Probability • Conditional Probability Joint Probability
Probability Theory • Sum Rule The marginal prob of X equals the sum of the joint prob of x and y with respect to y • Product Rule The joint prob of X and Y equals the product of the conditional prob of Y given X and the prob of X
p(X,Y) p(Y) Y=2 Y=1 p(X|Y=1) p(X) Illustration
The Rules of Probability • Sum Rule • Product Rule • Bayes’ Rule = p(X|Y)p(Y) posterior likelihood × prior
Application of Prob Rules p(X=a) = p(X=a,Y=r) + p(X=a,Y=b) = p(X=a|Y=r)p(Y=r) + p(X=a|Y=b)p(Y=b) P(X=o) = 9/20 =0.25*0.4 + 0.75*0.6 = 11/20 p(Y=r|X=o) = p(Y=r,X=o)/p(X=o) = p(X=o|Y=r)p(Y=r)/p(X=o) = 0.75*0.4 / (9/20) = 2/3 Assume P(Y=r) = 40%, P(Y=b) = 60% P(X=a|Y=r) = 2/8 = 25% P(X=o|Y=r) = 6/8 = 75% P(X=a|Y=b) = 3/4 = 75% P(X=o|Y=b) = 1/4 = 25%
Application of Prob Rules p(X=a) = p(X=a,Y=r) + p(X=a,Y=b) = p(X=a|Y=r)p(Y=r) + p(X=a|Y=b)p(Y=b) P(X=o) = 9/20 =0.25*0.4 + 0.75*0.6 = 11/20 p(Y=r|X=o) = p(Y=r,X=o)/p(X=o) = p(X=o|Y=r)p(Y=r)/p(X=o) = 0.75*0.4 / (9/20) = 2/3 Assume P(Y=r) = 40%, P(Y=b) = 60% P(X=a|Y=r) = 2/8 = 25% P(X=o|Y=r) = 6/8 = 75% P(X=a|Y=b) = 3/4 = 75% P(X=o|Y=b) = 1/4 = 25%
Mean and Variance • The mean of a random variable X is the average value X takes. • The variance of X is a measure of how dispersed the values that X takes are. • The standard deviation is simply the square root of the variance.
Simple Example • X= {1, 2} with P(X=1) = 0.8 and P(X=2) = 0.2 • Mean • 0.8 X 1 + 0.2 X 2 = 1.2 • Variance • 0.8 X (1 – 1.2) X (1 – 1.2) + 0.2 X (2 – 1.2) X (2-1.2)
y x The Multivariate Gaussian
References • SC_prob_basics1.pdf (necessary) • SC_prob_basic2.pdf Loaded to HuskyCT