Download
1 / 25
250 likes | 328 Views
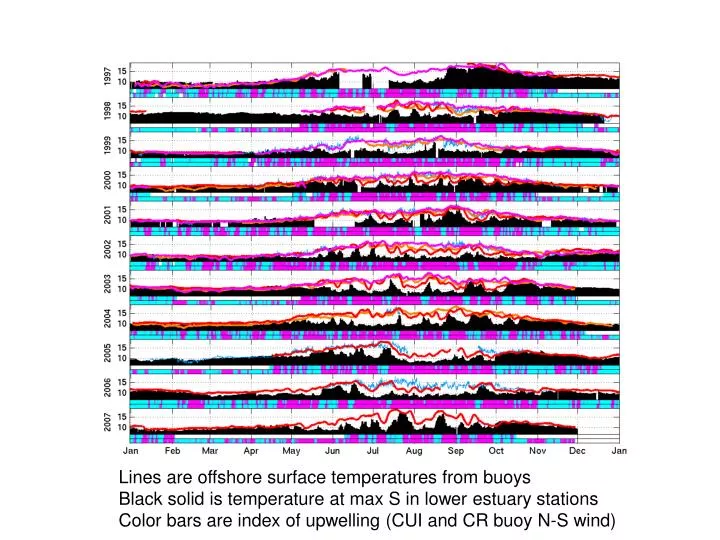
Lines are offshore surface temperatures from buoys Black solid is temperature at max S in lower estuary stations Color bars are index of upwelling (CUI and CR buoy N-S wind). Other buoys. Classifying normalized temperature. Train the classifier on summer 2004 data

E N D
Lines are offshore surface temperatures from buoys Black solid is temperature at max S in lower estuary stations Color bars are index of upwelling (CUI and CR buoy N-S wind)
Classifying normalized temperature • Train the classifier on summer 2004 data • Raw T at max S in lower estuary (red26, jetta, sandi) marked as • Downwelling if T>11 • Upwelling if T<10 • Intermediate if 10<T<11 • (based on nitrate-S-T relationship from Ken Bruland) Only works for data normalized on buoys with extensive data in summer 2004 (46041 and 46050)
Index based on T at max S in lower estuary Index based on mean buoy Other indexes Red = downwelling, Blue = intermediate, Green = upwelling
During 2006, instruments were deployed at ogi01 at 1m (blue), 5m (green), 10 m (red), and 50 m (light blue) Black line shows estimated temperature of ocean end-member for estuary, based on s-t regression and on T at max S Challenge: categorize estuary Additional images
Other sources • Salinity data in lower estuary (32 + psu = upwelling) • RISE buoys (multi-level data in 2004 and 2005) • Additional offshore nitrate profile data • Eventually, saturn-01 continuous nitrate data will provide a strong test of the upwelling index
Index based on T at max S in lower estuary Red = downwelling, Blue = intermediate, Green = upwelling
Index based on T at max S in lower estuary Red = downwelling, Blue = intermediate, Green = upwelling
Index based on extrapolated T Index based on mean buoy Red = downwelling, Blue = intermediate, Green = upwelling
Index based on extrapolated T Red = downwelling, Blue = intermediate, Green = upwelling
Index based on extrapolated T Red = downwelling, Blue = intermediate, Green = upwelling