Download
1 / 9
90 likes | 155 Views
This study focuses on isolating enzymes from fecal strains grown on gluten agar for potential therapeutic applications. Different strains were evaluated and characterized using zymography, SDS-PAGE, and casein zymography techniques. The results provide insights into enzyme activity and specificity from the isolated strains.

E N D
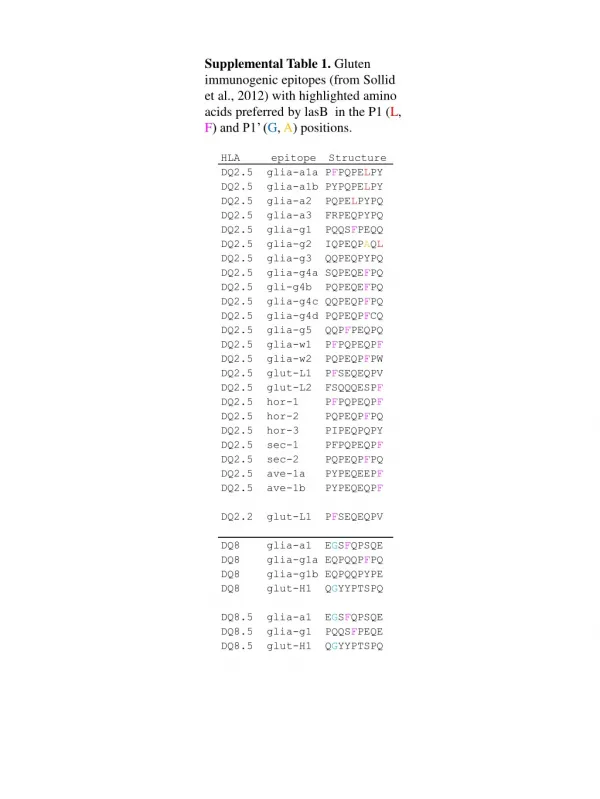
Supplemental Table 1. Gluten immunogenic epitopes (from Sollid et al., 2012) with highlighted amino acids preferred by lasB in the P1 (L, F) and P1’ (G, A) positions.
B A C D 1 2 3 4 5 6 7 8 9 10 Supplemental Figure S1. Appearance of some fecal strains on gluten agar (GA) and their evaluation in a gliadin zymogram. A and B, dilutions of fecal suspensions plated on GA. C, Colonies showing a clear zone were subcultured to purity on blood agar and their appearance was confirmed on segmented GA plates. D, evaluation of the eight strains in C on gliadin zymogram (lanes 2-9). Cells loaded were harvested from 150 µl OD620 5.0. Left lane: molecular weight standard; right lane: R. mucilaginosa (150 µl OD620 5.0).
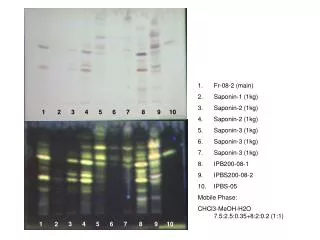
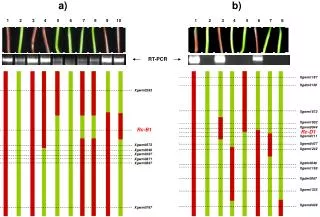
1 2 3 4 5 6 7 8 9 10 1 2 3 4 5 6 7 8 9 10 Supplemental Figure S2. Gliadin zymography of fecal strains. Cells were harvested from BA and suspended in PBS to an OD620 of 5.0. Cells in 50 µl aliquots were harvested by centrifugation, resuspended in zymogram samples buffer and applied to the gel. A, lane 1: MW std; lanes 2-10: fecal strains FA-28, -30, -31,- 32, -34, -35, -37, -38, -39. B, lane 1: MW std; lanes 2-9: strains FA-3, -10, -13, -22, -46, -29, -36, -42. Lane 10: Oral strain R. mucilaginosa ATCC 25296 (50 µl OD620 5.0). All FA strains were obtained from GA plates at pH 4.0.
Supplemental Figure S3. Selection of fecal strains, grown on gluten agar for 48 h under aerobic conditions at 37°C. The starting color of the agar is as shown in the plate on the lower right corner. The other colors are the result of pigments produced by the bacteria during growth. All strains were later identified as P. aeruginosa.
M 1 2 3a 3b 4 5 6 7 8 9 10 11 12 13 14 15 16 C M kDa A 250 150 100 75 50 37 25 20 15 10 A M 1 2 3a 3b 4 5 6 7 8 9 10 11 12 13 14 15 16 C M kDa B 250 150 100 75 50 Supplemental Figure S4. SDS-PAGE and casein zymography of P. aeruginosa proteins separated by DEAE (linear gradient). A, SDS-PAGE (4-12%) of 200 µl aliquots of the fractions shown in Figure 1B. B, Casein zymogram gel (6%) of 200 μl desalted aliquots of the fractions shown in Figure 1B. M, MW standard; C: aliquot of the whole P. aeruginosa cell sonicate (pre-DEAE). (5 μl). The SDS gel was silver-stained, the zymogram gel was stained with Coomassie brilliant blue. Fractions indicated in red contained the enzyme and eluted as minor peaks just after the first major peak in the DEAE chromatogram.
EDTA (+) EDTA (-) M F4 F4 M F4 F4 Supplemental Figure S5.Effect of EDTA on P. aeruginosa protease activity. Aliquots of 0.04 μg of isolated protease fraction F4 were subjected to gliadin zymography (8%) in duplicate under non-reduced conditions. The gel was divided in two, and one half was renatured and developed in the absence of EDTA (EDTA-), and the other half in the presence of 5 mM EDTA (EDTA+). Lane 1, MW std; lane 2: empty; lanes 3 and 4: protease fraction F4 (0.04 µg/lane).
Commercially obtained lasB DEAE fractions with enzyme activity MW std d2 d3 d4 d5 d6 d7 d8 d9 PaE LC-ESI-MS/MS results: kDa 250 150 100 75 50 37 25 20 15 10 1 2 Supplemental Figure S6.Isolation and identification of the lasB enzyme from P. aeruginosa strain FA-10. A, SDS PAGE; B, LC-ESI-MS/MS results of two bands excised from the SDS PAGE gel (bands in fractions d5 and d6). The protein migrated at the expected molecular weight in the gel and was conclusively identified as lasB.
Supplemental Figure S7. X-ray crystalographic resolution of pseudolysin at 1.5Å. The catalytic zinc is shown as a light grey CPK sphere. The structural calcium ion is shown as a yellow CPK sphere. The zinc ligands are shown in ball-and-stick representation: His337 and His341 in purple and Glu361 in blue. Catalytic residues are shown in ball-and-stick representation: Glu141 in blue, Asp168 and Asp338 in pink, and His420 in purple. (From: http://merops.sanger.ac.uk).
-/-/-/g ┼ Lfiv/a/-/- (based on 70 cleavages) Supplemental Figure S8. Cleavage specificity information of pseudolysin from P. aeruginosa. (From: http://merops.sanger.ac.uk).