Download
1 / 29
300 likes | 416 Views
This presentation by Peter Lane at the EUTO 2008 explores the mechanisms and tools necessary for measuring destination performance in tourism. It provides an overview of the UK’s response to growing tourist needs and highlights various initiatives to improve services and ensure effective visitor experiences. Key topics include visitor satisfaction measurement, quality standards, and the framework for local authority tourism organizations. Attendees will learn about strategies to enhance customer experiences and build cohesive networks for improved tourism management.

E N D
Measuring Destination Performance Peter Lane DP:UK EUTO 2008 25TH Sept
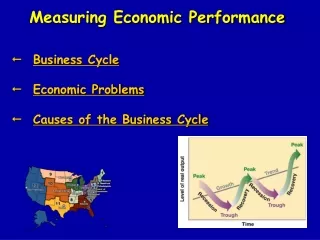
Topics To Be Covered • An overview of measurement and the tools used • What prompted greater activity in the UK • The response – DP:UK • Other initiatives
The Guiding Principle If you can’t measure it how can you manage it?
The quality of a “tourism experience” Tourist NEEDS and WANTS Services & Activities Expected Benefits Expectations before travel The experience The Reality Expectations QUALITY Reality = Expectations
Quality Loop Expected quality Targeted quality users satisfaction measurement Output measurement Perceived quality Delivered quality
Lodging Tourist Attraction Entertainment Shopping Beaches Services Probability of Return Frequency of Return Tourist Satisfaction QSP System
Un Cliente Satisfecho Es Un Cliente Leal Z. de aprecio Zona de indiferencia “Apostol” 100% 80% 60% 40% 20% %RETENCION Zona de defeccion “Terrorista” 1 2 3 4 5 Muy insatisfecho Muy satisfecho GRADO SATISFACCION
Visitors’ expectations Better market research and customer feedback Managers’ perception of visitors’ needs More effective communication of accurate images and messages Closer working between all players with a strategy for product development and agreement on targets and standards Setting quality standards for services and facilities Regular inspections, quality control, improvement schemes and training Actual quality provided Better communication, labelling and information services for visitors Filling the Gaps Visitors’ perception of what they receive
VISITORS TOURISM ENTERPRISES COMMUNITY DESTINATION Intact or improved environment Improved enterprise performance Increased income/employment Community benefits without conflict Satisfied customers
Pre visit image/ messages Attractions and amenities Pre visit information Making Bookings Journey to destination Information in destination Initial welcome Places to stay Places to eat Infrastructure and environment Farewell and return journey After visit contact and memories Tourism Value Chain
Leadership Model People Management 9% Policy and Strategy 8% Resources 9% Enablers People Satisfaction 9% Customer Satisfaction 20% Impact on Society 6% Results Business Results 15% Leadership 10% Processes 14%
Specific Activities • Volume and Value measurement • Visitor surveys • Tourist Information Centre Data • Destination Benchmarking • Data sharing eg European Cities Marketing
Catalyst for Action in England The Best Value Process
What is/was Best Value ? “The continuous search by a council to improve the quality, efficiency and effectiveness of all its activities for the public”
E E E C C C C F F THE MANTRA 4 C’s 3 E’s Not forgetting the 2 F’s
PRINCIPLES OF BEST VALUE • Radical reappraisal of all services by reference to a common framework known as the four Cs. • Challenge • Compare • Consult • Compete
Supported by: • The three Es • Economy • Efficiency • Effectiveness • What matters is what works.
What did it mean for Local Authority services ? • There was no hiding place There was no hiding place
To achieve a coherent network of local authority tourism organisations operating in accordance with the principles of best practice. Vision
Mission To improve the quality of tourism provision amongst local authority tourism departments and destination management organisations by offering advice on the components of best practice and encouraging the sharing of comparative information.
Objectives • > To work at a national level with the Audit Commission and DCMS to draw up performance indicators and measures • > To work with other like-minded national and regional organisations to assist destination development by providing support, comparative data, advisory publications and case studies • > To develop a national network of similar destinations with a shared agenda> To be recognised as a strategic group for issues relating to tourism performance and policy • > To act as a platform for consultation and comment on tourism performance and policy • > To act as a catalyst for discussion of such issues amongst relevant organisations
Specific Activities • Performance Management / Baseline • Research • Group Meetings • Advisory Publications • Web site (www.dpuk.org.uk)
The Future • Partners for England • English Tourism Intelligence Partnership • The importance of place making • Delivery of tourism services • Performance management
European Dimension • Tourism Sustainability Group and Report • Quality • Competitiveness • Sustainability • Employment • Data • Knowledge sharing