Download

1 / 31
310 likes | 481 Views
Updating the Historical Sunspot Record. Leif Svalgaard Stanford University SOHO-23. Sept. 25, 2009. The Sunspot Record(s!). The Sunspot Record goes back 400 years and is the basis for many reconstructions of solar parameters (e.g. TSI) But, how good is it?

E N D
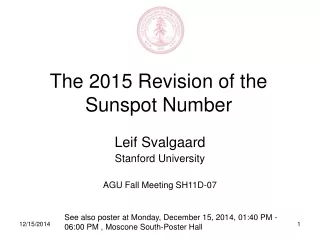
Updating the Historical Sunspot Record Leif Svalgaard Stanford University SOHO-23. Sept. 25, 2009
The Sunspot Record(s!) • The Sunspot Record goes back 400 years and is the basis for many reconstructions of solar parameters (e.g. TSI) • But, how good is it? • And can we agree on which one [Wolf; Group]? • Are the old values good? • Are the new ones? • What is a ‘good’ or ‘correct’ Sunspot Number?
Rudolf Wolf’s ‘Relative’ Sunspot Number: R = 10·Groups + Spots Wolf started his own observations in 1849 Rudolf Wolf 1861 1837 111.0 Different ! SIDC 2009 1837 138.3 25% higher
Rudolf Wolf’s ‘Relative’ Sunspot Number: R = 10·Groups + Spots Wolf started his own observations in 1849 Rudolf Wolf 1861 1837 111.0 Different ! SIDC 2009 1837 138.3 25% higher
Evolution of Wolf Number(why the changes?) Wolf published several versions of his celebrated ‘Relative’ Sunspot Numbers based on data gathered from many Observers both before and during Wolf’s own lifetime. How to ‘harmonize’ data from different observers?
Wolf’s Elegant Solution A current system in the ionosphere is created and maintained by solar FUV radiation. The current has a magnetic field of its own which is readily observed on the ground even with 18th Century technology. The amplitude [rD] of this variation is a proxy for FUV.
The Group Sunspot Number • Hoyt and Schatten proposed basing the Sunspot number on the Number of Groups reported by the observers: GSN = 12 Group The calibration constant 12 was used to make the value of the GSN comparable to Wolf’s Relative Sunspot Number
But the Number of Sunspot Groups is However also Observer Dependent Schwabe Wolf Carrington Shea Peters Spoerer Weber Schmidt Secchi Bernaerts Wolfer Aguilar Ricco RGO GSN = 12 kG Groups
GSN is Comparable to old Wolf Numbers before Calibrating to Magnetic Declination • Arlt [2008] has recently digitized Staudacher’s drawings and derived Sunspot Areas that here just ‘floats’ between GSN and Wolf:
Qualitative Difference Between GSN and Wolf [SSN] • Progressive increase vs. Step function Modern Maximum?
Probing Difference Between GSN and Wolf SSN SSN GSN There are good geomagnetic data for many stations during the intervals marked by ovals when there is a systematic difference between GSN and SSN
Sunspot Number as a Function of the Diurnal Range for the Stations • After 1880, GSN [pink, for stations after 1880] and SSN [blue, all stations] agree and cluster neatly along a common regression line Technical Detail: Y = H sin(D) The East component Y is really what varies during the day rather than Declination D. The Horizontal component varies from place to place causing D to vary.
Sunspot Number as a Function of the Diurnal Range for the Stations • The stations before 1850 [red diamonds] fall systematically below the regression line Multiplying GSN [Rg] by a factor 1.4 brings them up into good conformance with the SSN [Rz], open red diamonds
Original GSN Compared with Wolf SSN
Adjusted GSN Compared with Wolf SSN Both series now calibrated to Geomagnetic Response
Adjusted GSN Compared with Wolf SSN Both series now calibrated to Geomagnetic Response We still have the step function up to the ‘Modern Maximum’
Wolfer Changed Counting Method • Wolf did not count pores and the smallest spots. His assistant [and successor] Alfred Wolfer disagreed and argued that all spots, no matter how small, should be counted, and of course won the argument by staying longer on the right side of the grass. He introduced a correction factor, k, to bring his counts into conformance with Wolf’s [the tyranny of installed base]
The Confusing Coefficient k Wolfer compensated for his change in counting method by calculating an equivalent ‘Wolf Number’ as SSN = k (10 G + S), with k = 0.6, but since G is only rarely influenced by the change in counting the smallest spots, the equation should really have been SSN = 10 G + κS
Post Wolf Sunspot Numbers • This is NOT a graph of the SSN, but of the East Component [looks very much like the SSN] The Observers and their tenure intervals are indicated on the graph
The Waldmeier Discontinuity, I • Waldmeier’s counts are 22% higher than Wolfer and Brunner’s, for the same amplitude of the Diurnal Geomagnetic Variation.
Waldmeier was Inexperienced • Friedli [2005] writes: • “Zum Einen war Waldmeier vor seiner Ernennung zum Direktor der Eidgenössischen Sternwarte jahrelang der Leiter der Aussenstation in Arosa und hatte kaum Beobachtungserfahrung am Wolfschen Normalrefraktor in Zürich, zum Anderen hat Waldmeiers Vorgänger William Brunner nach seiner Emeritierung nicht mehr weiterbeobachtet und auch dessen langjähriger Assistent hat die Eidgenössische Sternwarte schon ein Jahr nach Waldmeiers Amtsantritt verlassen. Das neue Beobachtungsteam in Zürich war also relativ unerfahren und musste zudem noch während der Minimumsphase beginnen. Erschwerend kam hinzu, dass die beiden nachfolgenden Zyklen die intensivsten je direct beobachteten waren, mit bis zu 100 Einzelgruppen pro Sonnenrotation in den Maximumsphasen. Waldmeier hat denn auch selber befürchtet, sein als konstant angenommener Skalenfaktor könnte variieren.” • “The new observer-team in Zurich was thus relatively inexperienced” and “Waldmeier himself feared that his scale factor could vary”. We now know that his fear was not unfounded.
The RGO Sunspot Area Series • There is a strong correlation [with zero offset] between the Sunspot area [SA] and Rz = (1/r) • SA0.775. The ratio SA0.775/Rz is observer dependent. We see the same ~20% difference for Waldmeier
The Waldmeier Discontinuity, II • Histograms of the ratio values indicate that Waldmeier’s Rz are a factor of 3.39/2.88 = 1.18 too high
The Waldmeier Discontinuity, III • From ~40,000 CaK spectroheliograms from the 60-foot tower at Mount Wilson between 1915 and 1985 a daily index of the fractional area of the visible solar disk occupied by plages and active network has been constructed [Bertello et al., 2008]. Monthly averages of this index is strongly correlated with the sunspot number. The relationship is not linear, but can be represented by the following equation: R = [(CaK – 0.002167)*8999] 1.29 using data from 1910-1945, i.e. the pre-Waldmeier era. The SSN observed by Waldmeier is 20% higher than that calculated from CaK using the pre-Waldmeier relation.
The Waldmeier Discontinuity, IV • The value of the Ionospheric Critical Frequency foF2 depends strongly on solar activity. The slope of the correlation changed 20% between sunspot cycle 17 and 18 when Waldmeier took over.
Waldmeier Introduced a Discontinuity of 20% in the Zurich Sunspot Number. Correcting for this by increasing pre-Waldmeier SSN by 20% yields this suggested Sunspot Series: