Download
1 / 22
220 likes | 351 Views
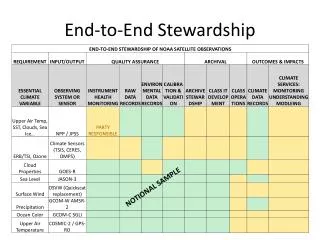
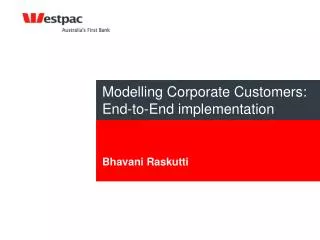
Modelling Corporate Customers: End-to-End implementation. Bhavani Raskutti. Successful end-to-end solution. The beginning The predictive modelling problem The challenges Our solutions Business impact of the solution Implementation in business Initial Current Key success factors.

E N D
Modelling Corporate Customers: End-to-End implementation Bhavani Raskutti
Successful end-to-end solution • The beginning • The predictive modelling problem • The challenges • Our solutions • Business impact of the solution • Implementation in business • Initial • Current • Key success factors
Business Imperatives The Beginnings Strong competitive pressures Large drops in margins for the first time Need to look for innovative methods to change the trend Belief in customer analytics Why research laboratories? Failure of traditional analysis approaches Availability of internationally recognised expertise Ability to provide objective solution Willingness to work with analysts in business
Client’s Statement of Objective The Beginnings • Project will target revenue improvement opportunities with an indicative $15 million in sales by: • undertaking a rapid analysis of Customer data from core systems, including front of house, customer satisfaction and marketing for customers with a spend greater than $100k, excluding state and local government • outcomes are to be validated using artificial intelligence tools and rigorous methodology by … Verbatim from client’s presentation to stake holders • Objective from Research Laboratories Perspective: • Use data analysis and mining to increase client’s revenue
Data Mining for increasing revenue Revenue improvement opportunities Win-back (database look-up) churn reduction (how do you stop the churn?) Up-sell/cross-sell to an existing customer Customer data Relationship with customer Customer satisfaction survey data Service assurance data (customer complaints) Demographic information about business customer Industry segment information Number of sites Revenue from customer Quarterly revenue from different products The Beginnings • Create models to predict up-sell based on revenue data
Predictive Modelling Objective • Model take-up of specific products • Develop models for ~4 high value products for two segments: large and medium businesses • Re-generate models quarterly for all products • Steps to build the solution • Population and target definition • Predictors for modelling • Choice of predictive modelling algorithm • Implementation • Segments • Products • Model management
Population and Target Definition Formal definition of take-up of a product P in billing period i by a customer Let riP be the revenue on product P in billing period i Potential targets in period i include all customers with r(i-1)P=0 Product take-up in period i iff r(i-1)P=0 and riP>TUMIN TUMIN > 0 is the minimum take-up amount determined by the business Challenges and Solutions Train;r(i-1)P=0 Labels i-1 i Predictors i i+1 Prediction; riP=0
Too Few Positive Examples Average number of take-ups for any product in any period is small Large businesses Less than 20 take-ups in a period for 70 of the 100+ products Less than 10 take-ups for 45 products Medium businesses Less than 20 take-ups for 71 products Less than 10 take-ups for 60 products Challenges and Solutions: Target Definition
Too Few Positive Examples (Cont’d) Challenges and Solutions: Target Definition Impact of data aggregation Minimum take-ups(n) for modelling Train r(i-j)P=0 j=1..2 i i+1 i-2 i-1 i i+1 i+2 i+3 Prediction r(i+j)P=0 j=0..1 Minimum take-ups(n) for modelling • Use of Data Aggregation • Target definition based on revenue over multiple billing periods • Product take-up in periods i..i+k-1 iff r(i-j)P=0 for j=1..k and j=0..k-1r(i+j)P >(kTUMIN)) k=2 is useful
Too Few Positive Examples (cont’d) Impact of time interleaving Challenges and Solutions: Target Definition Use of time interleaving Aggregate data with k=2 Generate 3 sets of data moved forward by a period Concatenate the 3 sets to get 3 times as much training data as for data aggregation with k=2 Labels T R A I N i-4 i-3 i-2 i-1 i-3 i-2 i-1 i i-2 i-1 i i+1 Predictors Prediction i i+1 i+2 i+3 • Time interleaving enormously enhances modellability
Predictors for Modelling Challenges and Solutions Train, r(i-j)P=0, j=1..2 Predictors Labels i i+1 i-2 i-1 • Revenue predictors used • r(i-2)Q – revenue for all products in billing period i-2 • Change in revenue from period i-2 to i-1, r(i-2)Q - r(i-1)Q • Projected revenue for period i, 2r(i-2)Q - r(i-1)Q • All revenue predictors used both as raw values, and normalised by total customer revenue • Binary predictors indicating churn/take-up in period i-1 • All continuous predictors converted to binary using 10 equisize bins • Overcomes the negative impact of large variance in revenues • Allows generation of non-linear models using linear techniques
Choice of Algorithm for Modelling Challenges and Solutions • Imbalance in class sizes • Large businesses • 51 products with < 0.5% take-up on average • 25 products with < 0.1% take-up • Medium businesses • 74 products with < 0.5% take-up on average • 54 products with < 0.1% take-up • Maximisation of total take-up revenue • Identifying new high value customers is a priority • Extent of variance • Take-up amounts range from TUMIN to over a million dollars • Take-up amounts are not correlated with total revenue in previous billing periods
Imbalance in class sizes Challenges and Solutions: Modelling Algorithm • m+ and m- : number of +ve and -ve examples • C+ and C- : weight of +ve and -ve examples • Use of Support Vector Machines (SVMs) instead of decision trees, neural nets or logistic regression • Based on Vapnik’s statistical learning theory • Maximises the margin of separation between two classes • Two different SVM implementations • SVMstd : equal weight to all training examples • SVMbal : class dependent weights so all take-ups have a higher weight than all non-take-ups
Identifying high value take-up Challenges and Solutions: Modelling Algorithm • m+ and m- : number of +ve and -ve examples • C- : weight of -ve examples • TU(i): Take-up amount of the ith +ve example • C+(i): weight of the ith +ve example • SVMval: SVM with different weights for different positive (take-up) training examples • All take-up examples have a higher weight than all the non-take-up examples (as for SVMbal) • Each take-up training example has a weight proportional to the amount of take-up
Model assessment and selection Challenges and Solutions: Modelling Algorithm • Model assessment • Two tests for assessing quality of models (~4,000 models) • 10-fold cross validation tests to determine the best of the 3 SVMs • Tests in production setting to evaluate time interleaving • All tests on 30 product take-up prediction problems in 4 segments • Performance measures on unseen test set • Area under receiver operating characteristic curve (AUC) • Measures quality of sorting • Decision threshold independent metric • Value weighted AUC (VAUC) • Indicates potential revenue from the sorting • SVMval with time interleaved data the stand-out performer • SVMval significantly more accurate than the other two • Time interleaving produces more stable models
Business impact Model Implementation • Predictive models identify more sales opportunities than that identified manually • 3 times as many in large businesses segment • 5 times as many in medium businesses segment • Results for 2 different regions in medium businesses • Region 1: Predictions for just 5 products generated 9 new opportunities with an increase in revenue of ~400K A$ • Region 2: Predictions identified opportunities that were already being processed by sales consultants • Predictive modelling spreads the techniques of good sales teams across the whole organisation
Technical Implementation Model Implementation • Segments • Rural corporate customer segment • All other corporate customers in 3 segments • Large • Medium • Small • Products • ~50 products in each segment • Products chosen by business analytics group • Model Re-generation and scoring • Quarterly after consolidated revenue figures are available • Scoring for all chosen products where model can be created • ~200 models re-generated and scored every quarter
Initial Implementation in Business Model Implementation • Models re-generated and scored quarterly by research labs • One prioritised customer list per product per segment • Sorted on likelihood of take-up in the next half year • Model explanation provided through weighted rules • Output delivered to business analytics group • Different cut-offs for different products/regions • Superimposition of other data for filtering/sorting • Use of output by sales consultants for product sales
Current Implementation in Business Model Implementation • Model management by business analytics group on their PC • One prioritised customer list per product per segment • Sorted on likelihood of take-up in the next half year • No model explanation provided • Output delivered to business analytics group • Different cut-offs for different products/regions • Superimposition of other data for filtering/sorting • Use of output for product packaging by sales consultants • Product-centric models used for customer-centric marketing
Key Success Factors • Willingness of stake-holders to try non-standard solutions • Innovative solution: Paper published in KDD 2005 • Target definition using multiple overlapping time periods to boost the number of rare events for modelling • Use of support vector machines for customer analytics • Being lazy • Scope change from 4 to 50 products • Scope change from 2 to 4 segments • Development of ~200 predictive models in one shot • No stale models in production • Working with business analysts to instigate change: • Product-centric modelling to customer-centric product packaging
What more would we do? • Implementation Platform • From shell scripts linking Matlab, Perl and C++ programs to a more supportable platform • Possibly a public domain SVM rather than an home-grown one for better maintainability • Research the impact of other predictors • Use the same approach for churn/retention models
For More Details • Refer to the paper entitled “Predicting Product Purchase Patterns for Corporate Customers” by Bhavani Raskutti & Alan Herschtal in Proceedings of KDD’05, Chicago, Illinois, USA