Download
1 / 36
370 likes | 587 Views
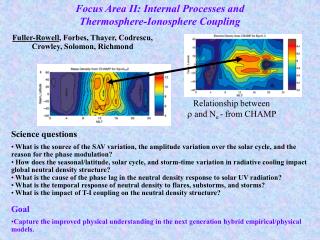
Focus Area II: Internal Processes and Thermosphere-Ionosphere Coupling. Fuller-Rowell , Forbes, Thayer, Codrescu, Crowley, Solomon, Richmond. Relationship between and N e - from CHAMP . Science questions

E N D
Focus Area II: Internal Processes and Thermosphere-Ionosphere Coupling Fuller-Rowell, Forbes, Thayer, Codrescu, Crowley, Solomon, Richmond Relationship between and Ne - from CHAMP Science questions • What is the source of the SAV variation, the amplitude variation over the solar cycle, and the reason for the phase modulation? • How does the seasonal/latitude, solar cycle, and storm-time variation in radiative cooling impact global neutral density structure? • What is the cause of the phase lag in the neutral density response to solar UV radiation? • What is the temporal response of neutral density to flares, substorms, and storms? • What is the impact of T-I coupling on the neutral density structure? Goal • Capture the improved physical understanding in the next generation hybrid empirical/physical models.
“Internal” Processes • Wave propagation • Neutral wind response to geomagnetic activity • Semi-annual variation • Thermosphere-ionosphere coupling - ETWA • Midnight temperature maximum (MTM) • Radiative processes - NO cooling (Geoff Crowley) • Response and recovery timescales - EUV, UV, storms (Stan Solomon)
Sources of Semi-Annual Variation in Neutral Density • Thermospheric “spoon” - solar cycle variation -CTIPe/TIEGCM • Variation in turbulent mixing and/or turbopause height from lower atmosphere sources - IDEA • Seasonal variation in geomagnetic heating - CTIPe/GGCM simulations • Seasonal variation in NO cooling - TIEGCM/CTIPe, IDEA, SABER
Solstice composition structure controlled by balance between solar and magnetospheric forcing Kp~3 Strickland et al., 2004: GUVI obs. Ratio of the height-integrated O and N2 above a reference level ~130km
Magnitude of Semi-Annual Variation in Neutral and Ion Density • Global circulation at solstice mixes the thermosphere like a spoon • Increase in molecular species at higher altitudes decreases scale height, RT/mg • Atmosphere more contracted at solstice reducing neutral density at a given height • Semi-annual variation in neutral density, composition, and ion density
Solar activity variation of semi-annual oscillation - implication for global circulation • Implies strength of global circulation increases with solar activity, or • Seasonal variation in geomagnetic energy input increases with solar activity • Note that the lower atmosphere atmosphere forcing/mixing less likely to have solar cycle variation courtesy Bruce Bowman
EIA and neutral density Peaks in neutral density associated with the EIA Liu et al. 2005
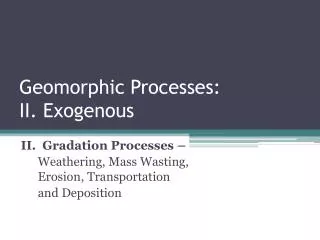
ETWAEquatorial Temperature and Wind Anomaly • Several theories have been suggested: • Adiabatic heating and cooling • Horizontal (zonal) transport • Joule dissipation • Ionospheric recombination Ragavarao 1991
Evidence of multi-day planetary wave periodicities in the upper atmosphere Dayside electrodynamics during 2001: day-to-day changes 5-day wave - possible signature of tropospheric planetary modulation of upper atmosphere Electrodynamics drives plasma transport Periodogram
Impact of parallel ion drag: increased latitude structure Maruyama et al.
Solar cycle variation of midnight temperature maximum Diurnal, Semi-Diurnal, and Ter-diurnal Variation at Low Latitude High solar activity Low solar activity Observations and modeling indicates MTM comparable to dayside peak at low solar activity
Internal Processes • Radiative processes - NO cooling (Geoff Crowley)
Energy Balance Temperature Structure Density Structure Thermospheric Density and Nitric Oxide G Crowley University of Texas at San Antonio (UTSA)
Mol and therm conductionRadiationAdvection Adiab.Other Energy equation Many terms
Cooling Terms O(3P) 63 mm O(3P) fine structure NO 5.3 mm Nitric Oxide CO2 15 mm Carbon Dioxide O3 9.6 mm Ozone Km Molecular Conduction DIFKT Eddy Diffusion Cooling Heating Terms in TIMEGCM QEUV EUV (1-1050 Å) (EUVEFF= 5%) QSRC O2 -Schumann-Runge continuum (1300 -1750 Å) QSRB O2 -Schumann-Runge bands (1750-2000 Å) QO3 O3- Lyman a (1215.67 Å) O3- Hartley, Huggins and Chappuis (203-850 nm) QO2 O2- Lyman a (1215.67 Å) O2 Herzberg (2000-2420 Å) QNC Exothermic neutral-neutral chemistry (NOX, HOX, OX, CH4, O(1D) quench, CLX) Atomic O recombination Heating from O(1D) quenching QIC Exothermic ion-neutral chemistry QA Non-Maxwellian auroral electrons (AUREFF= 5%) QP Photoelectrons (X-rays, EUV, and Night) (EFF=5%) QEI Collisions between e-, ions and neutrals QDH 4th order diffusion heating QGW Gravity Waves QM Viscous Dissipation QJ Joule heating QT Total Heating Dynamical terms Adiabatic cooling Horizontal Advection Vertical Advection
Cooling Terms O(3P) 63 mm O(3P) fine structure NO 5.3 mm Nitric Oxide CO2 15 mm Carbon Dioxide O3 9.6 mm Ozone Km Molecular Conduction DIFKT Eddy Diffusion Cooling Heating Terms in TIMEGCM QEUV EUV (1-1050 Å) (EUVEFF= 5%) QSRC O2 -Schumann-Runge continuum (1300 -1750 Å) QSRB O2 -Schumann-Runge bands (1750-2000 Å) QO3 O3- Lyman a (1215.67 Å) O3- Hartley, Huggins and Chappuis (203-850 nm) QO2 O2- Lyman a (1215.67 Å) O2 Herzberg (2000-2420 Å) QNC Exothermic neutral-neutral chemistry (NOX, HOX, OX, CH4, O(1D) quench, CLX) Atomic O recombination Heating from O(1D) quenching QIC Exothermic ion-neutral chemistry QA Non-Maxwellian auroral electrons (AUREFF= 5%) QP Photoelectrons (X-rays, EUV, and Night) (EFF=5%) QEI Collisions between e-, ions and neutrals QDH 4th order diffusion heating QGW Gravity Waves QM Viscous Dissipation QJ Joule heating QT Total Heating Dynamical terms Adiabatic cooling Horizontal Advection Vertical Advection
Cooling Terms O(3P) 63 mm O(3P) fine structure NO 5.3 mm Nitric Oxide CO2 15 mm Carbon Dioxide O3 9.6 mm Ozone Km Molecular Conduction DIFKT Eddy Diffusion Cooling Heating Terms in TIMEGCM QEUV EUV (1-1050 Å) (EUVEFF= 5%) QSRC O2 -Schumann-Runge continuum (1300 -1750 Å) QSRB O2 -Schumann-Runge bands (1750-2000 Å) QO3 O3- Lyman a (1215.67 Å) O3- Hartley, Huggins and Chappuis (203-850 nm) QO2 O2- Lyman a (1215.67 Å) O2 Herzberg (2000-2420 Å) QNC Exothermic neutral-neutral chemistry (NOX, HOX, OX, CH4, O(1D) quench, CLX) Atomic O recombination Heating from O(1D) quenching QIC Exothermic ion-neutral chemistry QA Non-Maxwellian auroral electrons (AUREFF= 5%) QP Photoelectrons (X-rays, EUV, and Night) (EFF=5%) QEI Collisions between e-, ions and neutrals QDH 4th order diffusion heating QGW Gravity Waves QM Viscous Dissipation QJ Joule heating QT Total Heating Dynamical terms Adiabatic cooling Horizontal Advection Vertical Advection
SMIN SMAX Effect of Solar Cycle on Cooling (Equinox) SMIN SMAX 148 162 91 91 45 K/day 450 K/day
255 387 SMIN SMAX 148 162 SMIN SMAX 91 91 Effect of Solar Cycle on Heating (Equinox)
NITRIC OXIDE SMAX SMIN 5.3 mm cooling + TN
Effect of Solar Flare on NO Cooling How does this affect neutral density?
Effect of Storms on NO Cooling(December Solstice) 12-hr Storm How does this affect neutral density?
Energy Balance Temperature Structure Density Structure Conclusions • We expect a relationship between density and energy input into the atmosphere • Energy content is not fixed and stable • Using global models we can examine the energy budget • Nitric oxide is a highly variable component of the energy budget • Expect NO will influence thermospheric density response • Need to study magnitude of response for Smin and Smax • Need to study timescale of NO response and how it relates to density response
Internal Processes • Response and recovery timescales - EUV, UV, storms (Stan Solomon)
Response of the Thermosphere to Solar Irradiance:Model Results and the Lag Effect Stan Solomon and Liying Qian High Altitude Observatory National Center for Atmospheric Research with thanks to Bruce Bowman Air Force Space Command NADIR MURI Kickoff • CU/LASP • 27 November 2007
Ionization Processes and Atmospheric Heating Photon flux enters the atmosphere Ionization processes convert photon energy to chemical potential energy Dissociative recombination converts ionization energy to dissociation products and kinetic energy i.e., heat
Model-Data Comparison for 2003 07337 08744 12138 12388 14483
Evidence for a “Lag” in Solar Forcing of the Thermosphere • MSIS and other empirical models have traditionally used a solar index (e.g., F10.7) from the previous day to describe thermospheric densities/temperatures for the current day. • Common sense dictates that it will take some finite time for the thermosphere to respond to a change in forcing. • Bruce Bowman reports incrementally improved correlations between satellite-drag measurements of thermospheric density and empirical models when a component of the proxy set includes solar measurement data in the far-ultraviolet, with a lag of about 6 days. • These improved correlations also occur when a solar chromospheric index (e.g., Mg II core-to-wing ratio) is used instead of direct measurements, with a ~6-day lag. • But keep in mind that all solar activity indices are highly mutually correlated.
The Thermospheric Energy Chain — “Catch and Release” Highly simplified description of important chemical pathways Consider EUV v. FUV 30.4 nm photon: Deposits energy ~150~200 km h + N2 N2+ + e* e* + N2 N2+ + e* e* + N2 N + N + KE (~1 eV) N2+ + e N + N + KE (~6 eV) N2+ + O NO+ + N + KE (~3 eV) NO+ + e N + O + KE (~3 eV) N + O2 NO + O + KE (~1 eV) NO + N N2 + O + KE (~4 eV) 150 nm photon: Deposits energy ~100~150 km h + O2 O + O + KE (~3 eV) O + O + M O2* + M + KE (~1 eV) O2* + M O2 + KE (~4 eV) O2* O2 + h but this recombination can only happen below ~100 km!
Validating this Theory — Work in Progress • Demonstrate lag effects with 3D model • Investigate vertical transport timescales with 3D model • Investigate atomic/molecular oxygen change/interchange • Calculate atomic oxygen recombination energetics • Compare with data using increased methodological rigor