Download
1 / 55
550 likes | 704 Views
Data Driven Practice for Program Managers: Riverside County Melissa Correia Adam Darnell Casey Family Programs Daniel Webster, MSW PhD Center for Social Services Research University of California, Berkeley Riverside County DPSS 10281 Kidd Street, 2nd floor - Conference Room 2a & 2b

E N D
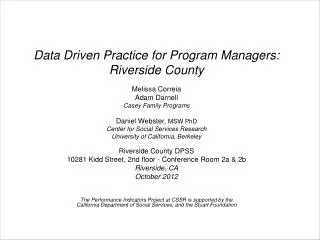
Data Driven Practice for Program Managers: Riverside County Melissa Correia Adam Darnell Casey Family Programs Daniel Webster, MSW PhD Center for Social Services ResearchUniversity of California, Berkeley Riverside County DPSS 10281 Kidd Street, 2nd floor - Conference Room 2a & 2b Riverside, CA October 2012 The Performance Indicators Project at CSSR is supported by the California Department of Social Services, and the Stuart Foundation
Riverside CountyUsing data to achieve outcomes and inform practice.
Managing with Data Provides us the ability to: • Improve agency transparency and accountability (what did we do and how well did we do it?) • Connect processes to desired outcomes • Focus on key priorities • Identify what needs attention • Target resources and strategize on what work needs to be done • Tell the story • Engage stakeholders and staff, create urgency for action
Barriers to Managing with Data • Data only framed as punitive “gotcha” • Data presented in silos / processes disconnected from outcomes • Lack of definitions / poorly labeled graphs and tables • Drowning in data – measure and report on what is useful, know your audience • Data Abuse
The View Matters Key Analytic Concepts: Melissa CorreiaDaniel Webster
the current placement system*(highly simplified) the foster care system a bunch of stuff happens CHILD IN CHILD OUT *adapted from Lyle, G. L., & Barker, M.A. (1998) Patterns & Spells: New approaches to conceptualizing children’s out of home placement experiences. Chicago: American Evaluation Association Annual Conference
Key Outcome Areas in Child Welfare Rate of Referrals/ Substantiated Referrals Home-Based Services vs. Out-of-Home Care Reentry to Care Permanency Through Reunification, Adoption, or Guardianship Counterbalanced Indicators of System Performance Use of Least Restrictive Form of Care Shorter Lengths Of Stay Well Being Maintain Positive Attachments Stability Of Care
Basic Terminology Process Measures - familiar to staff, relevant at a caseworker level, current. Connected to outcomes! Examples: Quality and quantity of activities such as: on time transportation; frequency of visits… Outcome Measures - the “big picture” measure of system performance, especially when looked at longitudinally Examples: entry rates, timely reunification, exits to permanency, re-entries…
Mean: the average value for a range of data Median: the value of the middle item when the data are arranged from smallest to largest Mode: the value that occurs most frequently within the data Measures of Central Tendency 12 4 15 63 7 9 4 17 4 4 7 9 12 15 17 63 = 9.7 7 = 9 Data 101
Minimum: the smallest value within the data Maximum: the largest value within the data Range: the overall span of the data Measures of Variability 4 4 7 9 12 15 17 63 Data 101
One of the most powerful ways to work with data… Disaggregation involves dismantling or separating out groups within a population to better understand the dynamics and plan strategies for improvement Useful for identifying critical issues that were previously undetected Disaggregation Aggregate Permanency Outcomes Race/Ethnicity Service Bureau Age Placement Type Data 101
Connecting the Dots Quality Service Review Measures: Engagement, support, involvement in case planning Outcome Measures: Timely reunifications; placement stability; improved well-being Mgmt/Dashboard Reports: Frequency and Quality of worker visits with birth parents, foster parents, children. Quality Service Review: Individualized Services Process Data: Accountability and case mgmt - Relevant to workers and supervisors Outcomes: “So What?” Reflect Key Priorities of Leadership Intermediate Outcomes Relevant to workers, supervisors, managers
The strongest associations with timely permanency included: Caseworker Visits with Parents Child’s Visits with Parents and Siblings in Foster Care Services to Children, Parents, & Foster Parents Family/Child Involvement in Case Planning ASFA Requirements Regarding Termination of Parental Rights Placement Stability Factors Associated with Timely Reunification, Guardianship, and Permanent Relative Placement Administration for Children and Families, U.S Department of Health and Human Services, Findings From the Initial Child and Family Services Reviews, 2001–2004. Available at http://www.acf.hhs.gov/programs/cb/cwmonitoring/results/index.htm
the data landscape… Three key data samples
The view matters… January 1, 2010 July 1, 2010 December 31, 2010 Source: Aron Shlonsky, University of Toronto (formerly at CSSR)
Riverside County in Context Overview of child welfare data
Nationwide, and in CA, the number of children in out of home care has been declining. Throughout these slides, CA data are from the CWS/CMS Dynamic Report System at http://cssr.berkeley.edu/ucb_childwelfare/default.aspx National data are from NCANDS and AFCARS
Riverside County has experienced a somewhat different trend. The number of children in out of home care declined substantially between 2007 and 2009 and has been relatively stable since Throughout these slides, CA data are from the CWS/CMS Dynamic Report System at http://cssr.berkeley.edu/ucb_childwelfare/default.aspx National data are from NCANDS and AFCARS
Key Questions: Prevention and In Home Services • For children that come to the attention of your agency – what proportion receive in-home and community-based services? (Compare to the proportion that enter care) • Describe trends in service provision – how long are cases open? What services are provided? At what cost? • Are there differences by region? Age? Race? • Do children enter care during or after services? • Do children experience repeat allegations or repeat maltreatment?
Between 2005 and 2010, the percent of children not experiencing repeat maltreatment increased and then declined in Riverside. It remains below the CA statewide average and the national standard.
National and State and County Level Children entering care
Questions to Consider: Entries (removals) • Who are the children who are coming into care? (Demographic and case characteristics) Use rates per population, or per referrals received to make comparisons • Why are they entering care? (removal reasons, prior svc history) • What strategies might impact different populations? • Review trends and local geographic variation – would the program(s) have equal impact in all regions? • What jurisdictions have lower entry rates? How do the populations differ? Have similar states been successful in reducing entries?
Comparing child welfare outcomes across jurisdictions can be useful to generate discussion about differences in demographics, policy, practice and service array
Nationwide Children Entering Care, Child Welfare: Babies of color have the highest rate of entry (FY10, per 1000) Data source: AFCARS
In CA and in Riverside County, entry rates are highest among African American and Nativechildren. Entry rates are also highest for infants. This is consistent with national trends.
For most children, entry rates increased steadily from 1998 through 2006, declined through 2009, and have begun to increase.Changes in entry rates are most dramatic for African American children and infants
Practice Discussion • What specific policy, practice, or service changes have had the most impact on the number of children entering care? • Where has the impact been strongest? Where has this been less effective? • What challenges remain?
National and State and County Level Children in carePoint in time
Key Questions: Children currently in care • What are the population demographics (age, race) • Has the number in care been changing or stable over time? • Is there a large group of older youth who have been in care a long period of time? What are the existing barriers to permanency for these youth? • What types of placements are children in? • What are children’s case plan goals? Are there differences by region, age, race?
Children in care by age: Riverside County Child Welfare In care rates have declined for all children in Alameda County, but there are differences by age. The youngest children still have the highest rate in care. (per 1,000 in the population)
Children in care by Race/Ethnicity: Alameda County Child Welfare (rate per 1,000 child pop) In care rates declined most dramatically among African American children and youth
Placement Type – Point in Time: Compared to statewide data, Riverside county has a similar proportion of children placed in kinship care, and a smaller proportion of children and youth placed in group care.
National State and County Level Outcomes: Exits and Length of stay
Key Questions: Permanency • How long do children stay in care after removal (longitudinal analysis) • What proportion of children entering care will eventually reunify? • What proportion of reunified children will re-enter care? • What about children/youth who have already been in care long periods of time? • How does this differ by age, race, risk factors, placement type, case type, geography? • Has this been changing or stable over time? • What interventions are currently in place to promote permanency? Are they achieving the desired results?
Compared to the state, children entering care in Riverside County are more likely to be reunified within 12 months Performance declined in 2011 after improving steadily.
Timely Reunification 2011 First Entries: Child WelfareWhich groups of children are the most likely to return home within 12 months?
Timely Reunification 2011 First Entries: Child WelfareWhich groups of children are the most likely to return home within 12 months?
In Riverside, African American youth are the most likely to re-enter