Download
1 / 14
140 likes | 321 Views
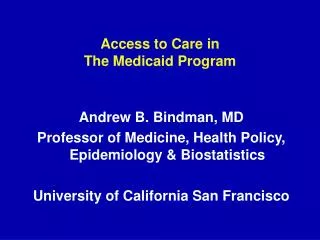
Access to Care in The Medicaid Program. Andrew B. Bindman, MD Professor of Medicine, Health Policy, Epidemiology & Biostatistics University of California San Francisco. Medicaid Expenditures by Service, 2006. DSH Payments 5.6%. Home Health and Personal Care 14.8%. Inpatient 14.1%.

E N D
Access to Care in The Medicaid Program Andrew B. Bindman, MD Professor of Medicine, Health Policy, Epidemiology & Biostatistics University of California San Francisco
Medicaid Expenditures by Service, 2006 DSH Payments 5.6% Home Health and Personal Care 14.8% Inpatient 14.1% Physician/ Lab/ X-ray 3.8% Mental Health 1.0% Long-Term Care 35.8% Acute Care 58.5% ICF/MR 4.3% Outpatient /Clinic 6.8% Nursing Facilities 15.7% Drugs 5.5% Payments to Medicare 3.3% Other Acute 6.9% Payments to MCOs 18.0% Total = $304.0 billion Urban Institute based on CMS Form 64 prepared for Kaiser Commission on Medicaid and the Uninsured.
Medicaid as Share of National Health Care Spending 2007 $131 $228 $2,098 $697 $702 Total National Spending (billions) CMS Office of the Actuary, National Health Statistics Group, National Health Expenditure Accounts, 2009.
Access Problems by Insurance Status Adults Children Adults Children No Usual Source of Care Needed Care but Did Not Get It KCMU analysis of 2007 NHIS data
State Budget Challenges Could Impact Medicaid Beneficiaries’ Access • Reductions in Provider Payments • Reductions in Enrollment • Managed Care
Physician Participation by Insurance Type % Accepting All New Patients % Accepting No New Patients Cunningham, Peter and May, Jessica. “Medicaid Patients Increasingly Concentrated Among MDs.” 2006
Factors Contributing to Physicians Participating in Care of Medicaid Patients • Participation is voluntary • Some avoid Medicaid patients due to • Patient characteristics and complexities • Concerns about being sued • Administrative hassles/payment delays • Participation varies most strongly in association with state payment rates • On average, Medicaid pays 70% of Medicare payments
Physicians’ Acceptance of Medicaid Patients and Fee Levels, 2001 Zuckerman et al, Health Affairs, 2004
Medicaid Eligibility • Any person who meets Medicaid eligibility criteria is entitled to benefit – no wait list • Federal requirement of at least annual determination of eligibility • Many states require or are considering more frequent determination of eligibility • State determined frequency and ease of Medicaid eligibility process affects the number of beneficiaries with enrollment gaps
Children without Gaps in Medicaid Coverage in CA Before and After Eligibility Determination Increased from 6 to 12 Months Percentage Years of Enrollment Bindman, et al. Medical Care, 2008
Preventable Hospitalizations Increase with Interruptions in Medicaid Coverage Cumulative Probability Time (Months) Bindman et al, Annals of Internal Medicine, 2008
Medicaid Managed Care • Delivery model used in most states • Potential to improve access through requirement for a primary care provider • Concern that access to high cost services (eg specialists) could be limited to save money • Some states looking to expand mandatory Medicaid managed care for a larger proportion of their beneficiaries
Medicaid Managed Care Enrollees as a Percent of State Medicaid Enrollees, June 2007 NH VT ME WA MT ND MN MA OR NY ID SD WI RI MI CT WY PA NJ IA NE OH IN NV WV DE IL IL UT VA MD CO CA MO CA KS KY NC DC TN OK SC AR AZ NM AL GA MS TX LA AK FL HI 0 - 60% (13 states) 61-70% (17 states including DC) U.S. Average = 64.1% FPL 71-80% (7 states) 81-100% (14 states) SOURCE:Medicaid Managed Care Penetration Rates by State as of June 30, 2007, CMS, HHS