Download
1 / 39
390 likes | 604 Views
7. The CPI and the Cost of Living. CHAPTER. Eye Ons. Consumer price index Nominal interest rate Cost of living index Nominal wage rate Reference base period Real interest rate Real wage rate Inflation rate . DEFINITION. CPI – Consumer Price Index Measure of the AVERAGE

E N D
7 The CPI and the Cost of Living CHAPTER Eye Ons Consumer price index Nominal interest rate Cost of living index Nominal wage rate Reference base period Real interest rate Real wage rate Inflation rate
DEFINITION • CPI – Consumer Price Index • Measure of the AVERAGE • of prices PAID • by URBAN consumers • for a FIXED MARKET BASKET • of CONSUMPTION goods and services • CPI = 100, in the Reference Base Period • Current Reference Base Period is 1982-1984
WHY DO WE CARE • CPI – Consumer Price Index • Jul 2007, CPI=208.3 • Average of prices paid by urban consumers for fixed market basket of goods • Was 108.3% in Jul 2007 than in 1982-1984 • Aug 2007, CPI=207.9 • Average of prices paid by urban consumers for fixed market basket of goods • Was 107.9% in Jul 2007 than in 1982-1984 • Comparing July 2007 to August 2007 tells us • Average of prices paid by urban consumers for fixed market basket of goods • Decreased by 0.4 from Jul to Aug 2007
CONSTRUCTING CPI • SELECT the MARKET BASKET • Weights of goods = urban household budget • CPI IS calculated monthly, Basket IS NOT updated monthly • Current basket (2007) is based on 2005 survey
CONSTRUCTING CPI • Conduct Monthly Price Survey • Prices recorded • 80,000 goods and services • In 30 metropolitan areas • Products must be exactly the same. • Thus, specific statistics must be recorded • Quality • Size • Weight • Packaging • And more
Cost of CPI basket at current period prices x 100 Cost of CPI basket at base period prices CONSTRUCTING CPI Calculating CPI – STEP 1 CPI =
Cost of CPI basket at current period prices x 100 Cost of CPI basket at base period prices CONSTRUCTING CPI Calculating CPI – STEP 2 CPI =
Cost of CPI basket at current period prices x 100 Cost of CPI basket at base period prices $50 $70 x 100 x 100 = 100 = 140 For 2005, the CPI is: $50 $50 For 2008, the CPI is: Calculating CPI – STEP 3 CONSTRUCTING CPI CPI =
CPI in current year CPI in previous year x 100 Inflation rate = CPI in previous year 140 120 x 100 = 16.7 percent Inflation rate = 120 6.1 THE CONSUMER PRICE INDEX • Measuring Inflation • Inflation rate is the percentage change in the price level from one year to the next.
700 Years of Inflation and Deflation These data show that inflation became a persistent problem only after 1900. During the preceding 600 years, inflation was almost unknown. There was a burst of inflation during the sixteenth century after Europeans discovered gold in America, but this inflation was less than 2 percent a year. Inflation eventually subsided.
700 Years of Inflation and Deflation The Industrial Revolution was a temporary burst of inflation. The graph provides dramatic evidence that inflation took off during the last century.
6.1 THE CONSUMER PRICE INDEX • Price level has increased every year. • Inflation = High in 1980’s, Low in 1990’s
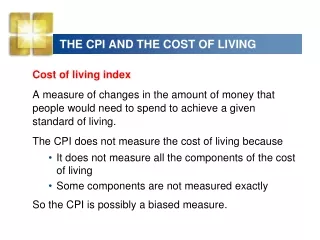
CPI and the COST OF LIVING • Cost of Living = • the amount of $$$ • a person must spend • to achieve a certain standard of living • CPI DOES NOT measure cost of living • Does not measure ALL components of living • Severe winter = increase in natural gas purchase • # price is caught but not quantity – basket is fixed • Components of CPI are not always ACCURATE • Thus, it would be a biased measure of changes in cost of living
CPI and the COST OF LIVING • BIAS in the CPI • New goods bias • New goods perform better but cost more [cost=quality] • Upward bias into the CPI and inflation rate • Quality change bias • Better products cost more [#price due to #quality IS NOT inflation, but would be counted as such] • Upward bias into the CPI and inflation rate
CPI and the COST OF LIVING • BIAS in the CPI • Commodity substitution bias • $ of beef rises faster than $ of chicken = you buy more chicken and less beef • CPI Basket is fixed and does allow for substitutions and says the price of meat has increased • Outlet substitution bias • Prices rise…people use discount stores more often • CPI Basket is fixed and does allow for substitutions and says the prices has decreased
CPI • EFFECTS of the BIAS in the CPI • Overstates inflation • Estimated to overstate inflation by 1.1% • Distorts Private Contracts • Union contracts • Increases Government Outlays • 48 Million Social security benefits • 22 Million Food stamps • 4 Million Pensions of Retired Personnel • 27 Million School lunch budgets
ALTERNATIVES to CPI • GDP Deflator • Average of • current prices of • all the goods and services included in GDP • expressed as a percentage of base-year prices. • GDP deflator = (Nominal GDP Real GDP) 100. • Price level is measured by GDP deflator • Inflation measured by % change in GDP deflator
Prices of ALL goods and services Weights items using CURRENT and PAST quantities Prices of CONSUMPTION goods and services Weights items using PAST quantities (from surveys) In theory GDP Deflator is NOT subject to CPI biases. [includes new goods, quality changes, and allow for substitutions] In reality: the commerce department does not measure physical quantities of produced items. It divides expenditures by price indexes – one of which is CPI. GDP Deflator vs CPI GDP Deflator CPI
ALTERNATIVES to CPI • PCE Deflator • Average of • current prices of • all the goods and services included in consumption expenditure component of GDP • expressed as a percentage of base-year prices. • Overcomes the biases to some degree • Is a measure of cost of living
ALTERNATIVES to CPI • CPI is highest • PCE lies between CPI and GDP deflator
Deflating the GDP Balloon Part of the increase in nominal GDP reflects increased production and part reflects rising prices. You can think of GDP as a balloon that is blown up by growing production and rising prices.
Deflating the GDP Balloon The GDP deflator lets the inflation air—the contribution of rising prices—out of the nominal GDP balloon so that we can see what has happened to real GDP.
Deflating the GDP Balloon The figure shows the increase in nominal GDP from 1980 to 2007. With the inflation air removed, you can see by how much real GDP grew.
CPI in 2007 Price of stamp in 1907 dollars x CPI in 1907 207.2 = 41 cents = 2 cents x 10 ANOTHER USE of CPI • Prices on Different Dates • Convert the price of a 2-cent stamp in 1907 into its 2007 equivalent: Price of stamp in 2007 dollars =
Nominal wage rate in 2006 x 100 Real wage rate in 2006 = CPI in 2006 NOMINAL vs REAL VALUES • Nominal vs Real GDP • Learned in Chapter 5 • Nominal vs Real Wage Rate - Average hourly wage rate measured in • current dollars • dollars of a given reference base year • Nominal vs Real Interest Rate - Percentage return on a loan • expressed in dollars • calculated by purchasing power – nominal interest rate adjusted for the effects of inflation • Real interest rate = Nominal interest rate – Inflation rate.
Nominal wage rate in 2006 x 100 Real wage rate in 2006 = CPI in 2006 $16.73 x 100 = $8.23 Real wage rate in 2006 = 201.6 NOMINAL vs REAL WAGE RATE EXAMPLE • How to find the REAL WAGE RATE • given that years Nominal wage rate The $8.23 amount is in 19821984 dollars.
6.3 NOMINAL AND REAL VALUES Figure 6.4 shows nominal and real wage rates: 1982–2006. The nominal wage rate has increased every year since 1982. The real wage rate decreased slightly from 1982 through the mid-1990s, after which increased slightly.
6.3 NOMINAL AND REAL VALUES • Real interest rate = Nominal interest rate – Inflation rate. Figure 6.5 shows real and nominal interest rates: 1967–2007. During the 1970s, the real interest rate became negative. The nominal interest rate increased during the high-inflation 1980s.
The Nominal and Real Price of a First-Class Letter The figure shows the cost of a first-class letter since 1907. The green line is the nominal price—the actual price of a stamp in the dollars (cents) of the year in question.
The Nominal and Real Price of a First-Class Letter The red line is the real price—the price in terms of the 2007 dollar. The nominal price has gradually increased, but the real price has fluctuated—sometimes rising and sometimes falling.
The Nominal and Real Price of a First-Class Letter The highest real price, 45 cents, occurred in 1933 and the lowest real price, 19 cents, occurred in 1920.
The Nominal and Real Wage Rates of Presidents of the United States Who earned more, George W. Bush in 2005 or George Washington in 1789? George Washington was paid $25,000 in 1789. George W. Bush was paid $400,000 in 2005.
The Nominal and Real Wage Rates of Presidents of the United States Who earned more: Barack Obama in 2008 or George Washington in 1789? George Washington was paid $25,000 in 1789 (on green line), but in 2005 dollars, his real pay was $521,000 (on red line). Barack Obama was paid $400,000 in 2009.
The Nominal and Real Wage Rates of Presidents of the United States The White House is more comfortable and presidential travel arrangements today are a breeze compared to earlier times. So adding in the perks of the job, Barack Obama doesn’t get such a raw deal.
Cost of CPI basket at current period prices x 100 Cost of CPI basket at base period prices Nominal wage rate in 2006 x 100 Real wage rate in 2006 = CPI in current year CPI in previous year CPI in 2006 x 100 Inflation rate = CPI in previous year CPI in 2007 Price of stamp in 1907 dollars x CPI in 1907 FORMULAS CPI = GDP deflator = (Nominal GDP Real GDP) 100. • Real interest rate = Nominal interest rate – Inflation rate. Price of stamp in 2007 dollars =
Using the CPI • Suppose you have a student loan of $80,000. • Suppose that the CPI rises by 3 percent a year each year from now (2008) through 2028. • Also suppose that the nominal interest rate on your loan is fixed at 5 percent a year. • How much will a $100 repayment cost you in 2008 dollars, when you start to pay off your loan in 2018? • How much will a $100 repayment cost you in 2008 dollars, when you make your final payment in 2028? • What is the real interest rate that you will have paid?
Using the CPI • You can answer all these questions. • Set the CPI in 2008 equal to 100. • With the CPI rising at a rate of 3 percent per year, the CPI in 2018 will be 134. • A $100 payment in 2018 is equivalent to a $74 payment in 2008. ($100 ÷ 134) x 100 = $74. • The CPI in 2028 will be 181. • So a payment of $100 in 2028 is equivalent to a payment of $55 in 2008.
Using the CPI • The further in the future a payment is made, the less is your $100 payment in today’s dollars. • Your real interest rate is the 5 percent a year nominal interest rate minus the 3 percent a year inflation rate. • Your real interest rate is 2 percent per year.