Download
1 / 8
80 likes | 198 Views
Oligopoly is characterized by a small number of large firms whose fortunes are interdependent, meaning the actions of one firm directly affect the profits of its rivals. This chapter explores key concepts such as market dominance measured by concentration ratios, competitive strategies like the Cournot Model, and the implications of price wars. Additionally, we discuss the kinked demand curve, which helps explain price stability in oligopolistic markets, and the effects of brand allegiance on pricing strategies.

E N D
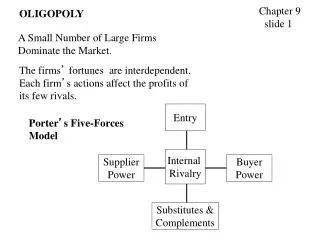
Chapter 9 slide 1 OLIGOPOLY A Small Number of Large Firms Dominate the Market. The firms’ fortunes are interdependent. Each firm’s actions affect the profits of its few rivals. Entry Porter’s Five-Forces Model Internal Rivalry Supplier Power Buyer Power Substitutes & Complements
9.2 OLIGOPOLY A Small Number of Firms Dominate the Market. The Degree of Market Dominance is Measured by the Concentration Ratio. CR = Percentage of Sales of the top 4 (8 or 20) Firms. Good or Service Concentration Ratio 4 Firms 8 Firms Glass Containers 91 97 Beer 90 93 Breakfast Foods 83 94 Motor Vehicles 80 96 Tires 68 86 Book Stores 65 71 Snack Foods 57 64 Motion Pictures 51 67 Fast Food 44 57 Lawn Equipment 40 57 Air Flights 34 51
P* Q* QS 9.3 Dominant Firm acting as Price Leader Industry Demand D S Supply Curve for Small Firms Leader’s Net Demand d MR MC Leader produces Q*, Small firms produce QS.
QUANTITY COMPETITION 9.4 The Cournot Model. Two Firms supply a market, where Demand is: P = 30 – Q1 - Q2. For each, LAC = LMC = $6/unit. Set MR = MC The greater is the rival’s output then the less is your own output. MR1 = [30 - Q2] – 2Q1 = 6. Thus, Q1 = 12 - .5Q2. Similarly, Q2 = 12 - .5Q1. In Equilibrium, Q1 = Q2 = 8. In turn, P = 30 – 16 = $14, and Each firm’s profit is: (14 – 6)(8) = $64.
$18 $14 $12 $10 $7.5 The Cournot Model (continued). 9.5 MR1 = [30 - Q2 .. - QN] – 2Q1 = 6. Thus, Q1 = 12 - .5(Q2 + … QN). For N Firms, P = 30 – Q1 - Q2 – Q3 … - QN. Firm’s produce identical outputs, so,Qi = 12 - .5(N-1)Qi. So, Q1 = Q2 = … QN = 24/(N+1). $30 N QTotal P 1 2 3 5 15 12 18 16 14 18 12 20 10 22.5 7.5 LAC = LMC = $6 Total Output
P* MR Q* MC MC 9.6 STABLE PRICES w/ KINKED DEMAND Price Demand Output With kinked demand, price is stable even as costs change.
9.7 A Price War If Both charge $8, Each Sells 2.5 M units. MC = $6 If Both charge $6, Each Sells 3.5 M units. If One charge $8 and the Other $6, They Sell 1.25 M and 6 M units. P2 = $8 P2 = $6 P1 = $8 10, 10 P1 = $6 5, 12 12, 5 12 7, 7 12 7 7 What is the Result of Strict Competition? Low Prices: (7, 7)
9.8 A Price War (Revisited) If Both charge $8, Each Sells 2.5 M units. MC = $6 If Both charge $6, Each Sells 3.5 M units. What if there is strong Brand Allegiance. So, if One charge $8 and the Other $6, They sell 2 M and 4 M units. P2 = $8 P2 = $6 P1 = $8 10, 10 P1 = $6 8, 8 8, 8 10 10 8 7, 7 8 Now, what is the Result of Competition? High Prices: (10, 10) !


![Chapter 9 [1]](https://cdn3.slideserve.com/5555934/chapter-9-1-dt.jpg)