Download
1 / 125
1.25k likes | 1.43k Views
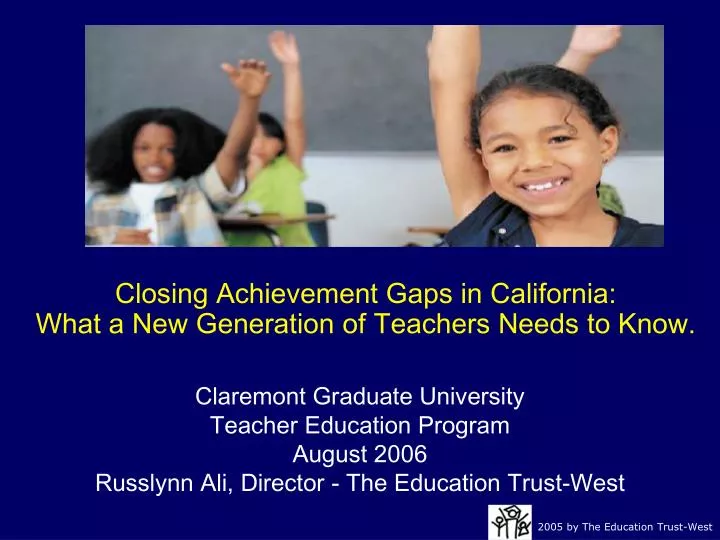
Closing Achievement Gaps in California: What a New Generation of Teachers Needs to Know. Claremont Graduate University Teacher Education Program August 2006 Russlynn Ali, Director - The Education Trust-West. Where Are We Now? US NAEP Long Term Trends.

E N D
Closing Achievement Gaps in California: What a New Generation of Teachers Needs to Know. Claremont Graduate University Teacher Education Program August 2006 Russlynn Ali, Director - The Education Trust-West
Good News: Looking at National Long Term Trends, Achievement Gaps for Younger Hispanic and African American Students Are Narrowing at the Elementary Level.But We’re Losing Traction in Middle School.
NAEP Reading, 9 Year-Olds:Record Performance for All Groups Source: National Center for Education Statistics, NAEP Data Explorer, http://nces.ed.gov/nationsreportcard/nde/
African American-White Gap Narrows to Smallest Size in HistoryNAEP Reading, 9 Year-Olds 26 35 29 Source: National Center for Education Statistics, NAEP Data Explorer, http://nces.ed.gov/nationsreportcard/nde/
Latino-White Gap Narrows to Smallest Size in HistoryNAEP Reading, 9 Year-Olds 21 28 24 Source: National Center for Education Statistics, NAEP Data Explorer, http://nces.ed.gov/nationsreportcard/nde/
NAEP Math, 9 Year-Olds: Record Performance for All Groups Source: National Center for Education Statistics, NAEP Data Explorer, http://nces.ed.gov/nationsreportcard/nde/
African American-White Gap Narrows to Smallest Size in HistoryNAEP Math, 9 Year-Olds 23 28 25 Source: National Center for Education Statistics, NAEP Data Explorer, http://nces.ed.gov/nationsreportcard/nde/
Latino-White Gap Narrows to Smallest Size in HistoryNAEP Math, 9 Year-Olds 17 26 21 Source: National Center for Education Statistics, NAEP Data Explorer, http://nces.ed.gov/nationsreportcard/nde/
8th GradeNAEP Reading, 13 Year-Olds Source: National Center for Education Statistics, NAEP Data Explorer, http://nces.ed.gov/nationsreportcard/nde/
But Gaps Getting Bigger in Middle School Latino-White Gap NAEP Reading, 13 Year-Olds 24 21 23 Source: National Center for Education Statistics, NAEP Data Explorer, http://nces.ed.gov/nationsreportcard/nde/
African American-White Gap NAEP Reading, 13 Year-Olds 18 29 22 Source: National Center for Education Statistics, NAEP Data Explorer, http://nces.ed.gov/nationsreportcard/nde/
NAEP Math, 13 Year-Olds Source: National Center for Education Statistics, NAEP Data Explorer, http://nces.ed.gov/nationsreportcard/nde/
African American-White GapNAEP Math, 13 Year-Olds 26 32 25 Source: National Center for Education Statistics, NAEP Data Explorer, http://nces.ed.gov/nationsreportcard/nde/
Latino-White Gap NAEP Math, 13 Year-Olds 23 24 20 Source: National Center for Education Statistics, NAEP Data Explorer, http://nces.ed.gov/nationsreportcard/nde/
NAEP Reading, 17 Year-Olds 21 29 Source: National Center for Education Statistics, NAEP Data Explorer, http://nces.ed.gov/nationsreportcard/nde/
NAEP Math, 17 Year-Olds 28 20 Source: National Center for Education Statistics, NAEP Data Explorer, http://nces.ed.gov/nationsreportcard/nde/
African American and Latino 17 Year-Olds Do Math at Same Levels As White 13 Year-Olds Source:National Center for Education Statistics, NAEP 2004 Long Term Trends
African American and Latino 17 Year-Olds Read at Same Levels As White 13 Year-Olds Source:National Center for Education Statistics, NAEP 2004 Long Term Trends
A National Crisis: The Nation is Losing Standing in the Global Economy. Program for International Student Assessment
Students in Other Countries Gain far More in Secondary School TIMSS
U.S. Ranking* Among OECD Countries has Remained the Same or Dropped between2000 and 2003 *Ranking out of 26 OECD Countries Source: Organization for Economic Cooperation and Development (OECD), PISA 2003 Results, data available at http://www.oecd.org/
2003: U.S. Ranked 24th out of 29 OECD Countries in Mathematics Source: Organization for Economic Cooperation and Development (OECD), PISA 2003 Results, data available at http://www.oecd.org/
Problems are not limited to our high-poverty and high-minority schools . . .
U.S. Ranks Low in the Percent of Students in the Highest Achievement Level (Level 6) in Math Source: Organization for Economic Cooperation and Development (OECD), PISA 2003 Results, data available at http://www.oecd.org/
U.S. Ranks 23rd out of 29 OECD Countries in the Math Achievement of the Highest-Performing Students* * Students at the 95th Percentile Source: Organization for Economic Cooperation and Development (OECD), PISA 2003 Results, data available at http://www.oecd.org/
U.S. Ranks 23rd out of 29OECD Countries in the Math Achievement of High-SES Students Source: Organization for Economic Cooperation and Development (OECD), PISA 2003 Results, data available at http://www.oecd.org/
Our 15-year-olds have a worse average scale score in mathematics than most of their international peers. Closest Competitor? Latvia. Source: OECD Problem Solving for Tomorrow’s World. 2004
PISA 2003: Problem-Solving, US Ranks 24th Out of 29 OECD Countries Source: NCES, 2005, International Outcomes of Learning in Mathematics, Literacy and Problem Solving: 2003 PISA Results. NCES 2005-003
More than half of our 15 year olds at problem-solving level 1 or below. Source: OECD Problem Solving for Tomorrow’s World. 2004
More than half of our 15 year olds at problem-solving level 1 or below. Just ahead of us? Russia and Latvia Source: OECD Problem Solving for Tomorrow’s World. 2004
PISA 5th-95th Gap Rank* Mathematical Literacy 8 Performance Of U.S. 15 Year-Olds Highly Variable Problem Solving 6 Reading 8 *Of 29 OECD countries Source: OECD, Learning for Tomorrow’s World: First Results From PISA 2003.
How Does California Compare?2005 National Assessment of Educational Progress
California Ranks Low Compared to Other States on NAEP – 4th Grade Reading Source: NCES, National Assessment of Educational Progress, 2005
California’s Ranking on NAEP – 8th Grade Reading Source: NCES, National Assessment of Educational Progress, 2005
Even when statistical significance is taken into account, almost every other state does better than California in 8th grade reading Source: NCES, National Assessment of Educational Progress, 2005
And Our Achievement Gaps Are Larger Than Many Other States Source: NCES, National Assessment of Educational Progress, 2005
Are California’s low achievement levels due to our demographics?
CA’s White Students Are Scoring Below White Students in Many Other States. Source: NCES, National Assessment of Educational Progress, 2005
California’s Non Low-Income Students Do Better Than Non Low-Income Students in Only Three Other States. Source: NCES, National Assessment of Educational Progress, 2005
MATH CSTAll Students 2006 *General Math – Tests Grades 6 & 7 Standards Source: California Department of Education, 2005