Download
1 / 45
450 likes | 733 Views
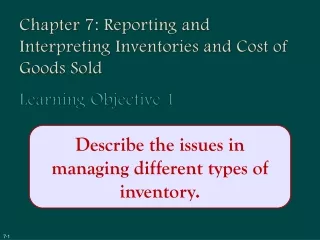
Ch.5 Accounting for Inventories and Cost of Goods Sold Prof. J. Wang. Part I Introduction. 1. merchandise inventory 2. I/S of a merchandise company 3. how companies keep track of their inventory: perpetual v. periodic systems 4. purchase of inventory on account 5. shipping cost.

E N D
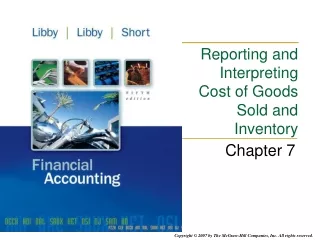
Ch.5Accounting for Inventoriesand Cost of Goods SoldProf. J. Wang
Part I Introduction
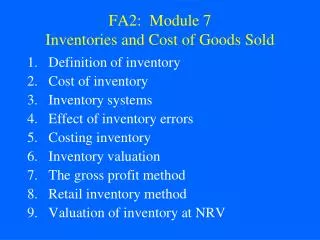
1. merchandise inventory • 2. I/S of a merchandise company • 3. how companies keep track of their inventory: perpetual v. periodic systems • 4. purchase of inventory on account • 5. shipping cost
1.1 Inventory of Wholesalers and Retailers • Purchased in finished form • Resold without transformation • Classified as “Merchandise Inventory” on balance sheet LO1
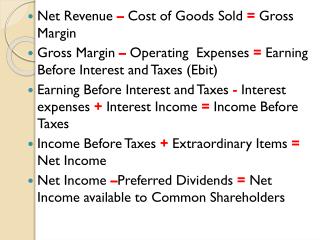
1.2 Condensed Income Statement for a Merchandiser Net sales $100,000 Cost of goods sold 60,000 Gross profit $ 40,000 Selling and administrative expenses 29,300 Net income before tax $ 10,700 Income tax expense 4,280 Net income $ 6,420
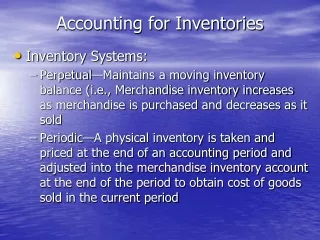
1.3 how companies keep track of their inventory • Perpetual inventory system • Periodic inventory system
Perpetual Inventory Systems Inventory records are updated after each purchase or sale • Point-of-sale terminals have improved the ability of mass merchandisers to maintain perpetual systems • Company knows the cost of sales and ending inventory figure from their books
Periodic Inventory Systems Inventory records are updated periodically based on physical inventory counts • Reduces record keeping but also decreases the ability to track theft, breakage, etc., and prepare interim financial statements
“Pool” of goods available to sell during the period An increase in ending inventory means more was bought than sold The Cost of Goods Sold Model Beginning inventory $ 15,000 + Cost of goods purchased 63,000 = Cost of goods available for sale 78,000 – Ending inventory (18,000) = Cost of goods sold $ 60,000
1.4 Purchase of inventory on account • Cash discount
Credit Terms and Sales Discounts n/30 Payment due 30 days from invoice date 1/10, n/30 Deduct 1% of invoice amount if paid within 10 days; otherwise full invoice amount is due in 30 days 2/10, n/30 Deduct 2% of invoice amount if paid within 10 days; otherwise full invoice amount is due in 30 days
On July 16, the company purchased merchandise inventory on account for $500. Term: 1/10, n/30. Dr. Purchases 500 Cr. A/P 500
On July 25, the company paid for the purchase, less discount. Accounts Payable 500 Cash 495 Purchase Discounts 5 Recording Purchase Discounts To record payment within discount period to supplier who offers 1% purchase discount. ($ 500 × 1% = $5 discount)
Cost of Goods Purchased • Includes invoice price: Less: Purchase returns and allowances Purchase discounts Plus: Transportation-in
Inventory Costs Included • Any freight costs incurred by buyer • Cost of insurance for inventory in transit • Cost of storing inventory before selling • Excise and sales taxes
Buyer Seller 1.5 Shipping cost:FOB Destination Point • No sale or purchase until inventory reaches its destination • Seller responsible for inventory while in transit Title passes at destination
Buyer Seller 1.5 Shipping cost:FOB Shipping Point • Both sale and purchase recorded upon shipment • Buyer responsible for inventory while in transit Title passes when shipped
Analysis of Profitability Of particular interest to current and potential investors Gross Profit % LO4
Gross Profit Ratio = Gross Profit Net Sales (How many cents on every $ of sales are left over after covering the cost of the product) Daisy’s Profitability Net sales $100,000 Cost of goods sold 60,000 Gross profit $ 40,000 Gross profit ratio = 40%
Part IIInventory Costing MethodHow to determine the cost of inventory left on hand and cost of inventory sold in a period of inflation
Inventory Valuation and Income Measurement Value assigned to inventory on balance sheet Value expensed as cost of goods sold on income statement When Sold = LO5
Detailed Costing Method Example What’re the cost of goods sold and ending inventory? Beginning inventory, Jan. 1: 500 units (unit cost $10) Inventory purchases: DateUnitsUnit Cost 1/20 300 $ 11 4/8 400 12 9/5 200 13 12/12 100 14 Total purchases 1,000 units Ending inventory, Dec. 31: 600 units
Inventory Costing Methods(in a period of inflation) Four costing methods available: Specific Identification Weighted Average First-in, First-out (FIFO) Last-in, First-out (LIFO) LO6
Specific Identification Method Step 1: Identify the specific units in inventory at the end of the year and their costs.
Specific Identification Method Units in ending inventory: Date purchasedUnitsCostTotal Cost 1/20 100 $11 $1,100 4/8 300 12 3,600 9/5 200 13 2,600 Ending inventory 600 $7,300 Units × Cost = Total cost
Specific Identification Method Step 2: cost of goods sold = cost of goods available for sale – ending inventory = 17,100 – 7,300 = 9,800 * Few companies use this method
Weighted Average Method Step 1: Calculate the cost of goods available for sale.
Weighted Average Method Date purchasedUnitsCostTotal cost Beg. inventory 500 $10 $ 5,000 1/20 300 11 3,300 4/8 400 12 4,800 9/5 200 13 2,600 12/12 100 14 1,400 Cost of goods available for sale 1,500 $17,100
: Weighted Average Method Step 2: Divide the cost of goods available for sale by the total units to determine the weighted average cost per unit.
Weighted Average Method • Cost of Goods Available for Sale • Units Available for Sale • $17,100 • 1,500 = $11.40/unit
Avg. Cost # of Units × Weighted Average Method Step 3: Calculate ending inventory and cost of goods sold by multiplying the weighted average cost per unit by the number of units in ending inventory and the number of units sold.
Weighted Average Method ALLOCATE TO Ending Cost of Inventory Goods Sold Units on hand 600 Units sold 900 Weighted average cost ×$11.40$ 11.40 Total cost of goods available of $17,100 allocated: $6,840 $10,260
1st in First-in, First-out (FIFO) Method Step 1: Assign the cost of the beginning inventory to cost of goods sold.
First-in, First-out (FIFO) Method ALLOCATE TO Ending Cost of UnitsCostInventoryGoods Sold 1/1 500 $10 $5,000 1/20 300 $11 4/8 400 $12 9/5 200 $13 12/12 100 $14
First-in, First-out (FIFO) Method Step 2: Continue to work forward until you assign the total number of units sold during the period to cost of goods sold. Allocate the remaining costs to ending inventory. etc. 3rd 2nd
First-in, First-out (FIFO) Method ALLOCATE TO Ending Cost of UnitsCostInventoryGoods Sold 1/1 500 $10 $5,000 1/20 300 $11 3,300 4/8 300 / 100 $12 $3,600 1,200 9/5 200 $13 2,600 12/12 100 $14 1,400 TOTALS $7,600 $9,500
1st in Last-in, First-out (LIFO) Method Step 1: Assign the cost of the last units purchased to cost of goods sold.
Last-in, First-out (LIFO) Method ALLOCATE TO Ending Cost of UnitsCostInventoryGoods Sold 1/1 500 $10 1/20 300 $11 4/8 400 $12 9/5 200 $13 12/12 100 $14 $1,400
1st in Last-in, First-out (LIFO) Method Step 2: Work backwards until you assign the total number of units sold during the period to cost of goods sold (allocate the remaining costs to ending inventory).
Last-in, First-out (LIFO) Method ALLOCATE TO Ending Cost of UnitsCostInventoryGoods Sold 1/1 500 $10 $5,000 1/20 100 / 200 $11 1,100 $ 2,200 4/8 400 $12 4,800 9/5 200 $13 2,600 12/12 100 $14 1,400 TOTALS $6,100 $11,000
Comparison of Costing Methods Cost of Goods Sold Goods Available for Sale Ending Inventory Specific Identification $7,300 $17,100 $ 9,800 Weighted Average 10,260 6,840 17,100 FIFO 7,600 9,500 17,000 6,100 11,000 LIFO 17,100
Comparison of Costing Methods Weighted AverageFIFOLIFO X X X X X In periods of rising prices: Highest cost of goods sold? Lowest cost of goods sold? Highest gross profit? Lowestnet income? Lowest income taxes? LO7
LIFO Conformity Rule • LIFO conformity rule • If used for tax, LIFO must also be used for books • In general, companies can use one accounting method for financial reporting purpose and use a different method for tax purpose. Accounting choice should be made based on which method produces most useful information.
Lower of Cost or Market(for your information only) • If inventory’s market value has fallen below the cost, the inventory must be reported at the lower market value, and a loss must be recorded.