Laser Anemometry
Laser Anemometry. P M V Subbarao Professor Mechanical Engineering Department. Creation of A Picture of Complex Turbulent Flows…. Laser Anemometry. Laser anemometry , or laser velocimetry , refers to any technique that uses lasers to measure velocity.

Laser Anemometry
E N D
Presentation Transcript
Laser Anemometry P M V Subbarao Professor Mechanical Engineering Department Creation of A Picture of Complex Turbulent Flows…..
Laser Anemometry • Laser anemometry, or laser velocimetry, refers to any technique that uses lasers to measure velocity. • The most common approach uses the Doppler shift principle to measure the velocity of a flowing fluid at a point and is referred to as Laser Doppler Velocimetry (LDV) or Laser Doppler Anemometry (LDA). • In some special flow situations, another approach using two nonintersecting, focused laser beams known as dual focus (also known as L2F) technique is used to measure flow velocity at a point. • More recently, laser illumination by light sheets is used to make global flow measurements and is referred to as particle image velocimetry (PIV). • The strength of PIV lies in its ability to capture turbulence structures within the flow and transient phenomena, and examine unsteady flows.
Laser Doppler Anemometry The concept of a Doppler shift is familiar phenomena. The faster the moving source of sound, the greater the shift in frequency. This effect is also observed with light. When light is reflected from a moving object, the frequency of the scattered light is shifted by an amount proportional to the speed of the object. It is possible to estimate the speed by observing the frequency shift. This is the basis for LDA. A flow is seeded with small, neutrally buoyant particles that scatter light. The particles are illuminated by a known frequency of laser light.
The scattered light is detected by a photomultiplier tube (PMT), an instrument that generates a current in proportion to absorbed photon energy, and then amplifies that current. • The difference between the incident and scattered light frequencies is called the Doppler shift.
Measure of Doppler Shift • The Doppler shift, fD, depends on the speed, V, and direction of the particle motion, the wavelength of the light, λ, and the orientation of the observer. • The orientation of the observer is defined by the angle α between the incident light wave and the photo detector [PMT]. • The direction of particle motion is defined by β, the angle between the velocity vector and the bisector of ABC.
Concept to Technology • A direct way to estimate fD is to measure the incident frequency, f, and the observed frequency, fO, and find the difference. • The Doppler shift is a very small fraction of the incident frequency, so this results in estimating a small value from the difference of two large values, a process with a high degree of uncertainty. • To improve the estimate of fD, a method using two incident beams has been developed. • In this configuration the incident beam is split into two beams of equal intensity.
The Difference Method • The beams are directed to intersect, and the point of intersection is the measurement volume. • Particles that pass through the measurement volume scatter light from both beams. • The frequency shift of the light scattered from each beam will be different.
The technology has numerous advantages over other techniques. • There is for instance no need for physical contact with the flow, so no disturbances occur and the technique can be applied to flows of highly reactive or extremely hot fluids and the like. • Furthermore a relatively high spatial resolution can be obtained by focusing the two laser beams. • These characteristics make LDA a valuable measuring technique with many applications.
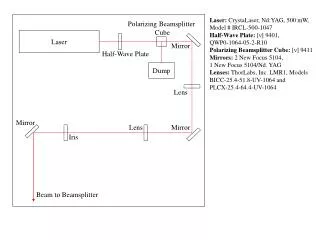
Schematic of LDA or LDV 2q df=l0/2sinq
Principle of Operation • The dual-beam approach is the most common optical arrangement used for LDV systems for flow measurement applications. • The transmitting optics include an optical element to split the original laser beam into two parallel beams and a lens system to focus and cross the two beams. • The intersection region of the two beams becomes the measuring region. • The receiving optics collect a portion of the light scattered by the particles, in the fluid stream, passing through the beam-crossing region and direct this light to a photodetector, which converts the scattered light intensity to an analog electrical signal. • The frequency of this signal is proportional to the velocity of the particle. • A signal processor extracts the frequency information from the photodetector output and provides this as a digital number corresponding to the instantaneous velocity of the particle. • The data processing system obtains the detailed flow properties from these instantaneous velocity measurements.
The frequency of the net (heterodyne) signal output from the photodetector system is given by
Principle of PIV • Particle Image Velocimetry (PIV) is a whole-flow-field technique providing instantaneous velocity vector measurements in a cross-section of a flow. • Two velocity components are measured, but use of a stereoscopic approach permits all three velocity components to be recorded, resulting in instantaneous 3D velocity vectors for the whole area. • The use of modern digital cameras and dedicated computing hardware, results in real-time velocity maps. • In PIV, the velocity vectors are derived from sub-sections of the target area of the particle-seeded flow by measuring the movement of particles between two light pulses:
Number of Particles • The number of particles in the flow is of some importance in obtaining a good signal peak in the cross-correlation. • As a rule of thumb, 10 to 25 particle images should be seen in each measurement area.