Download

1 / 36
360 likes | 447 Views
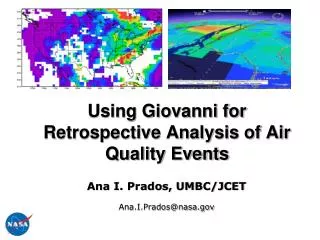
Chapter 7: Using Giovanni for Analysis of Air Quality Events in Central America. 11:00 – 12:00. What is Giovanni ?. Giovanni is a Web-based application developed by the NASA Goddard Earth Sciences Data and Information Services Center (GES DISC).

E N D
Chapter 7: Using Giovanni for Analysis of Air Quality Events in Central America 11:00 – 12:00
What is Giovanni ? • Giovanni is a Web-based application developed by the NASA Goddard Earth Sciences Data and Information Services Center (GES DISC). • Giovanni provides a simple and easy way to explore, visualize, analyze, and access vast amounts of Earth science remote sensing and model data. • Data sets generally available within 1-3 days • http://giovanni.gsfc.nasa.gov/
Giovanni at your Finger Tips • Only a Web browser is • needed. • No need to learn data formats and programming. • No need to download large amounts of data. • Customized data and analyses can be obtained with only a few mouse clicks.
AIRS MODIS 10-6 ppmv Aerosol from GOCART model MISR Parasol CloudSat CALIPSO TOMS OMI MLS HIRDLS HALOE TRMM AMSR-E SeaWiFS Giovanni Data Giovanni Tools Data Inputs Particulate Matter (PM 2.5) from AIRNow Aerosol from MODIS and GOCART model Carbon Monoxide from AIRS Giovanni Instances Models and more… Ozone Hole from OMI Water Vapor from AIRS MODIS vs SeaWiFS Chlorophyll
Giovanni Air Quality Data Products and Applications
Giovanni Air Quality Datasets Particulate Air Quality • MODIS TERRA and AQUA total and fine mode Aerosol Optical Depth (AOD) • MISR AOD • CALIOP Aerosol Feature Mask vertical curtain plots • OMI UV Aerosol Index • GOCART Model data – AOD speciation (2x2.5 degree) Trace Gases • OMI NO2 Tropospheric column (0.25x0.25 degree) • AIRS CO and methane (profile and total column observations)
Giovanni: Tools for Air Quality Applications • Customized visualization of air quality events Temporal and geographical selection of data products: - Latitude/longitude maps with overlay option - Time series plots - Hovmoller plots • Long range transport of pollutants - Temporal Animation plots of air quality data products
MODIS AOD: Smoke over Central America May 10th, 2007 • At least two daily observations - Terra and Aqua • Sensitive to Boundary Layer Industrial, smoke & dust aerosols • Well validated over land • Fine mode fraction
Air Pollution Trends using MODIS AOD 2003 – 2009 Costa Rica Best air quality in winter Worse air quality in Spring and Summer
Air Pollution Trends using MODIS AOD 2003 – 2009 Nicaragua, Honduras, El Salvador Best air quality in winter Worse air quality in Spring and early Summer
Monthly MODIS AOD over Central America January 2007 February 2007 Smoke June 2007 May 2007 Dust Smoke
OMI UV Aerosol Index: Smoke in Belize Guatemala, and Honduras • Mostly sensitive to absorbing aerosols above the planetary boundary layer , i.e. smoke plumes and dust
OMI Tropospheric NO2 Column December 2008 • Sensitive in the Boundary layer • Qualitative agreement with high NOx regions (i.e urban areas) • Not a real time product
Customized views of NO2Mexico and central America February 2008
Customized views of NO2 Greater quantities of NO2 over urban areas February 2008
Cloud-Aerosol Lidar and Infra-Red Pathfinder Satellite Observation (CALIPSO) 3D Visualization of Air Pollution • CALIPSO has a lidar that provides information about the vertical distribution of particles • Useful in conjunction with column AOD • Spatial resolution (vertical): 30 – 60 m • Temporal resolution: 16 days ± 20 – 50 km
Northern California Wildfires: June 23, 2008 Terra MODIS AOD Terra MODIS True Color and AQI Color Codes
532 nm Total Attenuated Backscatter June 23, 2008
Calipso and 3D-Visualization of Central American Biomass Burning – May 10th, 2007 Smoke plumes over Guatemala, El Salvador, Honduras and southern Mexico Optical Depth showing dense smoke over Central America and Mexico. CALIPSO vertical profile aerosols within the boundary layer
Now how do I acquire and generate Giovanni image visualizations ?
Instance Page for Gridded data Description Spatial Selection Some instances have vertical or wavelength selection Parameter Selection Temporal Selection Visualization Selection 23
Type latitude and longitude coordinates and click Update button Spatial Selection Click and drag Panning Click to select a map layer Zooming 24
Select to display more product information Click to hide the parameter group Check to select a group of parameters Check to select a parameter Click to show parameter description Parameter Selection
Temporal Selection The example shown is temporal selection for an instance featuring 3-hourly data. Dropdown menus for Date and Time selections. • Instances for monthly data have dropdown menu for Year and Month selections • Instances for daily data have dropdown menu for Year, Month, and Day selections. • Instances for hourly data have dropdown menu for Year, Month, Day, and Hour selections.
Visualization Selection Click to select a Visualization (also referred to as Analytical Function). “Lat-Lon Map, Time-averaged” is the common default option. Click to display the description of the selected Visualization (Analytical Function).
Giovanni Results Page • Result navigation tabs • Home • Result List • Download Data • Data Product Lineage • Acknowledgment Policy • Images • Refine Constraints • Spatial selection • Temporal selection • Graphical preferences • Submit Refinements
Results Page – Visualization result Result Navigation Tabs Download Data
Download multiple files Download Giovanni processed input data Group check boxes Image icons for single file download Result data KMZ files for Google Earth Results Page – Downloading data
Giovanni A-Train: Obtaining CALIPSO KMZs for 3D-Visualization
Results Page - Acknowledgment Policy Acknowledging the use of Giovanni is very important to us and to NASA. http://disc.sci.gsfc.nasa.gov/giovanni/Giovanni_usage_guidelines.shtml
How can I learn more about Air Quality Applications of NASA Earth Science data and Giovanni ?? • Check this web site regularly at http://aerocenter.gsfc.nasa.gov/asrs to find out about more workshops in 2009 on use of NASA Earth Science data sets and tools, including Giovanni • Further info: Ana.I.Prados@nasa.gov
Activity 5: Using Giovanni for Analysis of Air Quality Events • Participants should break into groups of 2. • Each participant will be given a worksheet that describes the steps for using Giovanni to analyze an air quality event in Central America. • Participants should work in their groups to complete the case study. • The instructors will be available during the activity to help participants and answer questions. • Goal: use Giovanni to analyze an air quality event.