Download
1 / 33
330 likes | 439 Views
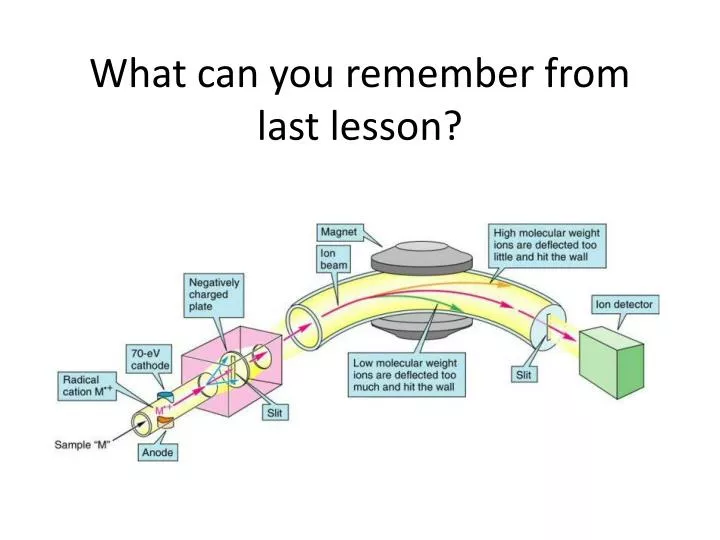
What can you remember from last lesson?. Aims: - To understand the basis of IR spectroscopy - To interpret IR spectra - To combine IR and MS data to identify molecules. INFRA RED SPECTROSCOPY. Molecules can absorb Infra-red radiation The absorbed energy makes covalent bonds vibrate.

E N D
Aims:- To understand the basis of IR spectroscopy- To interpret IR spectra- To combine IR and MS data to identify molecules
INFRA RED SPECTROSCOPY Molecules can absorb Infra-red radiation The absorbed energy makes covalent bonds vibrate
BENDING AND STRETCHING IN WATER MOLECULES SYMMETRIC STRETCHING
Symmetrical stretching Antisymmetrical stretching Scissoring Wagging Rocking Twisting
For a molecule to absorb IR photons there must be a CHANGE IN DIPOLE in the bond stretch or vibration e.g. H2O – only the stretching (top row) involve a change in dipole Symmetrical stretching Antisymmetrical stretching Scissoring Twisting Wagging Rocking
Molecules such as O2 and N2 do not appear on an IR spectrum. Symmetrical stretching Antisymmetrical stretching Scissoring Twisting Wagging Rocking
INFRA RED SPECTROSCOPY • Each bond vibrates and therefore absorbs infra-red radiation. • The exact frequency depends on: • The bond strength • The bond length • The mass of each atom in the bond
The Infra-red Spectrophotometer • a beam of infra red radiation is passed through the sample • a similar beam is passed through the reference cell • the frequency of radiation is varied • bonds vibrating with a similar frequency absorb the radiation • the amount of radiation absorbed by the sample is compared with the reference • the results are collected, stored and plotted
The Infra-red Spectrophotometer A bond will absorb radiation of a frequency similar to its vibration(s) normal vibration vibration having absorbed energy
The spectrum Vertical axis Absorbance the stronger the absorbance the larger the peak Horizontal axis Frequency wavenumber (waves per centimetre) / cm-1
INFRA RED SPECTRA - USES IDENTIFICATION OF PARTICULAR BONDS IN A MOLECULE The presence of bonds such as O-H and C=O within a molecule can be confirmed because they have characteristic peaks in identifiable parts of the spectrum.
INFRA RED SPECTRA - USES IDENTIFICATION OF PARTICULAR BONDS IN A MOLECULE The presence of bonds such as O-H and C=O within a molecule can be confirmed because they have characteristic peaks in identifiable parts of the spectrum. IDENTIFICATION OF COMPOUNDS BY DIRECT COMPARISON OF SPECTRA The only way to completely identify a compound using IR is to compare its spectrum with a known sample. The part of the spectrum known as the ‘Fingerprint Region’ is unique to each compound.
Uses of IR spectroscopy- Forensic science- Breathalyzers- Quality control in perfume production- Drug analysis
Watch the video clip and answer the questions How can a pair of atoms joined by a covalent bond be described? What frequency is needed to increase the vibration of molecules? How can we identify different functional groups? Why is a blank needed? How can an unknown sample be identified? http://www.rsc.org/learn-chemistry/resource/res00001041/spectroscopy-videos#!cmpid=CMP00001771
FINGERPRINT REGION • organic molecules have a lot of C-C and C-H bonds within their structure • spectra obtained will have peaks in the 1400 cm-1 to 800 cm-1 range • this is referred to as the “fingerprint” region • the pattern obtained is characteristic of a particular compound the frequency of any absorption is also affected by adjoining atoms or groups.
Interpreting spectra • You must be able to identify the following peaks. • You will have a data sheet to help.
IR SPECTRUM OF A CARBONYL COMPOUND • carbonyl compounds show a sharp, strong absorption between 1700 and 1760 cm-1 • this is due to the presence of the C=O bond
IR SPECTRUM OF AN ALCOHOL • alcohols show a broad absorption between 3200 and 3600 cm-1 • this is due to the presence of the O-H bond
IR SPECTRUM OF A CARBOXYLIC ACID • carboxylic acids show a broad absorption between 3200 and 3600 cm-1 • this is due to the presence of the O-H bond • they also show a strong absorption around 1700 cm-1 • this is due to the presence of the C=O bond
IR SPECTRUM OF AN ESTER • esters show a strong absorption between 1750 cm-1 and 1730 cm-1 • this is due to the presence of the C=O bond
O-H STRETCH AND C=O STRETCH WHAT IS IT? One can tell the difference between alcohols, aldehydes and carboxylic acids by comparison of their spectra. ALCOHOL O-H STRETCH ALDEHYDE C=O STRETCH CARBOXYLIC ACID
Identify the group next to the yellow box using the key below.
Identify the groups next to the yellow boxes using the key below.
Working backwardsWhich peaks would be present in the spectrum of….?a) A ketoneb) A secondary alcoholc) Alkene
Exam questionA compound was analysed by IR spectroscopy and Mass spectrometry. It gave strong absorbance at 1740 cm-1 and peaks at m/z values of 15, 29 and 72. The compound had the following composition by mass: C, 66.63%; H, 11.18%; O, 22.19%.Use this information to identify two possible structures of this compound.
Exam questionA compound was analysed by IR spectroscopy and Mass spectrometry. It gave strong absorbance at 1740 cm-1 and peaks at m/z values of 15, 29 and 72. The compound had the following composition by mass: C, 66.63%; H, 11.18%; O, 22.19%.Use this information to identify two possible structures of this compound.1) Calculate the empirical formula2) Use IR spectrum to identify the functional group(s)3) Use Mass spectrum to identify the parent ion (and therefore the molecular formula)4) Use Mass spectrum to identify the fragments5) Suggest the two possible identities of the molecule
Exam questionA compound was analysed by IR spectroscopy and Mass spectrometry. It gave strong absorbance at 1740 cm-1 and peaks at m/z values of 15, 29 and 72. The compound had the following composition by mass: C, 66.63%; H, 11.18%; O, 22.19%.Use this information to identify two possible structures of this compound.1) Calculate the empirical formula: C4H8O2) Use IR spectrum to identify the functional group(s) : C=O3) Use Mass spectrum to identify the parent ion (and therefore the molecular formula)72, so C4H10O4) Use Mass spectrum to identify the fragments: 15 = CH3+ 29 = C2H5+5) Suggest the two possible identities of the molecule: Butanal or butanone