Data and Methods
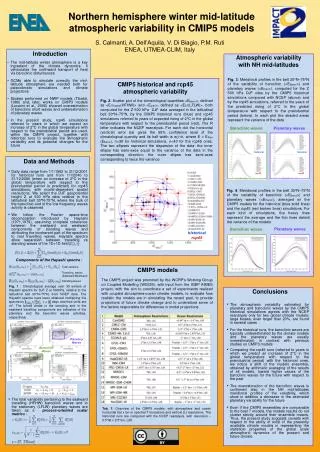
This study analyzes atmospheric variability in the Northern Hemisphere (NH) mid-latitudes using CMIP5 models across two periods: historical (1962-2001) and projected (2040-2080 under RCP45 scenarios). We focus on DJF geopotential height data at 500 hPa, selecting the 30°N-75°N latitudinal belt, crucial for understanding baroclinic disturbances. Utilizing Hayashi spectra for wave decomposition, we examine discrepancies in model simulation of baroclinic and planetary waves. Our findings reveal significant biases and inform future climate projections in the context of expected global temperature increases.

Data and Methods
E N D
Presentation Transcript
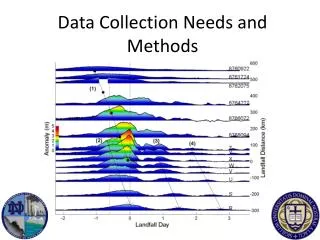
Introduction Atmospheric variability with NH mid-latitudes CMIP5 historical and rcp45 atmospheric variability historical historical Data and Methods • Daily data range from 1/1/1962 to 31/12/2001 for historical runs and from 1/1/2040 to 31/12/2080 (when an increase of 2°C in the global temperature with respect to the preindustrial period is predicted) for rcp45 simulations, with model-dependent spatial resolutions. We select the DJF geopotential height Z at 500 hPa data relative to the latitudinal belt 30°N-75°N, where the bulk of the baroclinic and of the low frequency waves activity is observed • We follow the Fourier space-time decomposition introduced by Hayashi (1971,1979), assuming complete coherence between the eastward and westward components of standing waves and attributing the incoherent part of the spectrum to real travelling waves. Hayashi spectra allow separation between travelling vs standing waves of the 1D+1D field : rcp45 rcp45 historical rcp45 Total variance CMIP5 models Travelling waves (Eastward/Westward) Standing waves Conclusions Northern hemisphere winter mid-latitude atmospheric variability in CMIP5 models S. Calmanti, A. Dell’Aquila, V. Di Biagio, P.M. Ruti ENEA, UTMEA-CLIM, Italy • The mid-latitude winter atmosphere is a key ingredient of the climate dynamics: it vehiculates the northward transport of heat via baroclinic disturbances • GCMs able to simulate correctly the mid-latitude atmosphere are needed both for paleoclimatic simulations and climate projections • Studies performed on NWP models (Tibaldi, 1986) and, later, works on CMIP3 models (Lucarini et al., 2006) showed overestimation of baroclinic short waves and underestimation of planetary waves • In the present study, rcp45 simulations referred to years in which we expect an increase of 2°C in the global temperature with respect to the preindustrial period are used, within the CMIP5 project, together with historical runs to evaluate the atmospheric variability and its potential changes for the future Fig. 3: Meridional profiles in the belt 30°N–75°N of the variability of baroclinic (<EBaroc>) and planetary waves (<EPlan>), computed for the Z 500 hPa DJF data by the CMIP5 historical simulations compared with NCEP (above) and by the rcp45 simulations, referred to the years of the predicted rising of 2°C in the global temperature with respect to the preindustrial period (below). In each plot the shaded areas represent the variance of the data Fig. 2: Scatter plot of the climatological quantities <Ebaroc>, defined as <ETR(east)(HFHW)> and <Eplan>, defined as <EST(LFLW)>, both computed for the Z 500 hPa DJF data averaged in the latitudinal belt 30°N–75°N, by the CMIP5 historical runs (blue) and rcp45 simulations referred to years of expected rising of 2°C in the global temperature with respect to the preindustrial period (red). The R letter indicates the NCEP reanalysis. For each dot the horizontal (vertical) error bar gives the 95% confidence level of the climatological quantity and its half width is σE/√n, where E = EPlan (EBaroc), n=39 for historical simulations, n=40 for the rcp45 ones. The two ellipses represent the dispersion of the data: the inner ellipse has semi-axes equal to the variance of the data in the corresponding direction; the outer ellipse has semi-axes corresponding to twice the variance Baroclinic waves Planetary waves Fig. 4: Meridional profiles in the belt 30°N–75°N of the variability of baroclinic (<EBaroc>) and planetary waves (<EPlan>), averaged on the CMIP5 models for the historical (blue solid lines) and the rcp45 (red broken lines) simulations. For each kind of simulations, the heavy lines represent the average and the thin lines delimit the variance of the models Planetary waves Baroclinic waves Components of the Hayashi spectra : The CMIP5 project was promoted by the WCRP's Working Group on Coupled Modelling (WGCM), with input from the IGBP AIMES project, with the aim to coordinate a set of experiments realized with coupled atmosphere-ocean climate models, to evaluate how realistic the models are in simulating the recent past, to provide projections of future climate change and to understand some of the factors responsible for differences in model projections Fig. 1 : Climatological average over 39 winters of Hayashi spectra for DJF Z at 500hPa, relative to the latitudinal belt 30°N–75°N, from NCEP data. The Hayashi spectra have been obtained multiplying the spectra by days and their units are m2. The boxed areas in the standing and in the eastward travelling components are indicative of the planetary and the baroclinic waves activities, respectively • The atmospheric variability estimated for planetary and baroclinic waves by the CMIP5 historical simulations agrees with the NCEP reanalysis only for two global climate models; large biases, even larger than 20%, are found in several cases • For the historical runs, the baroclinic waves are typically underestimated by the climate models and the planetary waves are usually overestimated, in contrast with previous studies on CMIP3 models • Comparing the rcp45 runs (referred to years in which we predict an increase of 2°C in the global temperature with respect to the preindustrial period) with the historical ones, we notice a shift of the models ensemble, obtained by arithmetic averaging of the results of all models, toward higher values of the baroclinic waves for the future with respect to the past • The overestimation of the baroclinic waves is confirmed also in the NH mid-latitudes meridional profiles of the variability, which show in addition a decrease in the estimated planetary variability for the future • Even if the CMIP5 ensembles are comparable to the best 7 models, the models results do not cluster strictly around their ensemble means. Thus, the present study suggests caveats with respect to the ability of most of the presently available climate models in representing the statistical properties of the global scale atmospheric dynamics of the present and future climate Planetary Waves BaroclinicWaves • The total variability pertaining to the eastward travelling (HFHW) baroclinic waves and to the stationary (LFLW) planetary waves are taken as a process-oriented scalar metrics: Tab. 1: Overview of the CMIP5 models, with atmosphere and ocean horizontal (lat x lon or spectral T truncation) and vertical (L) resolutions. The historical runs are compared with the NCEP reanalysis, with resolution ∼ 2.5°lat x 2.5°lon, L28