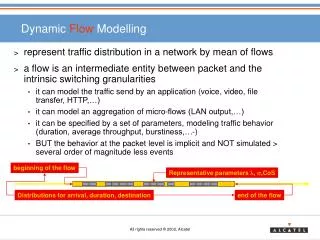
Download
1 / 16
160 likes | 314 Views
Developments in Critical Loads and Dynamic Modelling Maximilian Posch Coordination Center for Effects (CCE) ICP Modelling & Mapping (ICP M&M) Working Group on Effects (WGE) MNP, Bilthoven, The Netherlands. Update of CL and DM data in spring 2005: 2 calls for data:

E N D
Developments in Critical Loads and Dynamic Modelling Maximilian Posch Coordination Center for Effects (CCE) ICP Modelling & Mapping (ICP M&M) Working Group on Effects (WGE) MNP, Bilthoven, The Netherlands
Update of CL and DM data in spring 2005: • 2 calls for data: • CLs of heavy metals (Pb, Cd, Hg): • - different criteria (ecosystem/health) • - 18 NFCs responded • - EMEP/MSC-E provided depositions/conc. • (emission uncertainties!) • - Health->agriculture->fertiliser inputs important • - Pb more exceeded than Cd • - use in review/revision of HM Protocol as yet • undecided • - CCE Report distributed; available on www
Update of CL and DM data in spring 2005 (2): 2. CLs of acidity & nutrient N and DynMod of acidity: - 14/13 provided update (of 24 NFCs) - EMEP/MSC-W provided deposition data (also BC deposition!) - Overall, not many changes in CLs - DynMod clearly adds to complexity … - CCE Report being sent out; already available on www
Coverage: Grid: CL data from NFCs – Green: Also DynMod – Red: Also Target Loads
Exceedance of acidity CLs (1): Exceedance %: EU25: 17.9 11.0 7.0 4.1 3.7 3.4 1.8 Europe: 8.6 6.1 4.3 3.2 3.0 2.9 0.9
Exceedance of acidity CLs (2): Exceedance %: EU25: 17.9 11.0 7.0 4.1 3.7 3.4 1.8 Europe: 8.6 6.1 4.3 3.2 3.0 2.9 0.9
Exceedance of eutrophication CLs (1): Exceedance %: EU25: 65.2 60.4 55.9 45.7 40.9 38.6 24.6 Europe: 28.5 28.0 26.9 23.6 22.3 21.6 9.6
Exceedance of eutrophication CLs (2): Exceedance %: EU25: 65.2 60.4 55.9 45.7 40.9 38.6 24.6 Europe: 28.5 28.0 26.9 23.6 22.3 21.6 9.6
The Use of CLs in Integrated Assessment (IA) i.e. how CL data are used by CIAM/TFIAM • Use to date (Gothenburg Protocol, NEC Directive): • Within every 150x150 EMEP grid cell so-called (protection • and) exceedance isolines were calculated by the CCE • and provided to CIAM/TFIAM. • This is an approximation; and results in a large amount of data. • Also, the implementation in optimization algorithms is non-trivial. • New challenges: • - 50x50 grid: number of grids 500 4,000 • ecosystem-specific depositions (>= 3 per grid cell) • too many data and equations for optimisation …
… therefore new methodology: Linearised relationship between AAE and emissions: AAEk is the AAE in receptor k for the new (or to be determined) emissions Ep,j of pollutant p in emitter area j; AAE0,k is the AAE for the reference emissions E0,p,j; Np is the number of emitter regions for pollutant p, P is the number of pollutants (P=3), f is a unit conversion factor, K is the number of receptor areas. ap,k,j are the coefficients – impact factors -- determining the linear model, characterising the ‘strength’ of the relationship between emissions of pollutant p in country j and AAE in region k. [Similar methodology used in Life Cycle Impact Assessment]
Graphical representation of impact coefficients for eutrophication:
Graphical representation of impact coefficients for acidity:
How good is the linear approximation? (1) Country-to-country relationships (acidity & nutrient N): 2 examples: BE NL and DE SE acidity nutrient N acidity nutrient N SO2: red; NO2: green; NH3: blue
How good is the linear approximation? (2) (a) All countries GB (b) All countries to Europe acidification: red eutrophication: green
Ongoing Work: • Derive impact factors for Target Loads instead of • CLs (exceedance non-attainment) • Investigate how time information (RDT and DDT) • can be used in IAM
More information: • CCE reports 2005: • - Heavy Metals Report • - Status Report 2005 • CCE website: www.mnp.nl/cce • Thank you for your attention!