Download
1 / 15
150 likes | 260 Views
This study presents ultrasonic investigations of glass samples conducted at the University of Houston. Utilizing a pulser-receiver setup with 1MHz transducers, both compression and shear wave velocities were measured via pulse transmission and echo techniques. The research includes a detailed comparison of shear waveforms in three orthogonal directions for a blank glass sample and a glass sample (GS1) with laser bubble inclusions. Key findings discuss variations in wave velocity depending on the sample orientation and presence of inclusions. Visual data, including sample diagrams and waveforms, support the analysis.

E N D
University of Houston Ultrasonic investigations of Glasssamples By N. Dyaur June 7, 2010
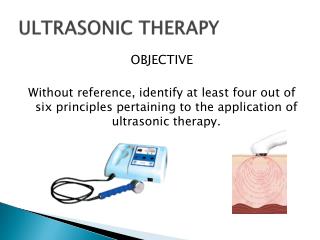
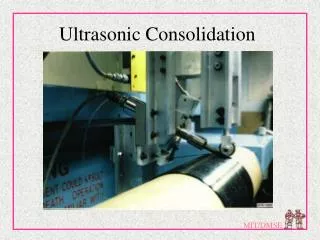
Ultrasonic pulls transmission technique for Velocity measurements. Transducers: Central frequency of P- and S-wave - 1MHz Device: Transducer and specimen holder Digital Oscilloscope Pulser-receiver Waveform on computer monitor Specimen
Pulse-transmission technique Pulse-echo technique
CV CV Comparison of Waveforms of Shear wave for three orthogonal directions of blank glass sample. G1 is the shortest distance and G3 is the largest distance. S-G-arrow show first point of arrival of S-wave.
Glass sample 1 (GS1) with inclusion of layered laser bubbles Inclusion: 26 x 48 x 48 mm Glass : 79 x 149 x209 mm 1 mm
Pictures of Glass sample 1 (GS1) 48 mm 209 mm 1 mm
Velocity of Compressional wave in the Glass sample 1 with included layered zone. Position of transducers and related velocity of p-wave (f= 1.MHz) CV CV
Comparison of measured velocity and estimated velocity for glass inclusion and inclusion zone. Sample GS1. CV CV Difference in velocity for layered zone depending on direction CV Zone Changes in velocity in % CV
CV Comparison of maximum Amplitude in first arrival Amplitude in Glass and Glass +Inclusion Zone . CV CV
Glass sample GS1 Layers in zone on laser bubbles inclusion. Orientation of laser bubbles in layer (red arrow) 1 mm
View in direction of orientation of laser bubbles. Glass sample GS1. 1 mm