Download
1 / 20
220 likes | 388 Views
Verification tools at the Norwegian Meteorological Institute. By Helen Korsmo EGOWS 2004. PRODUCTION AND VERIFICATION OF POINT FORECASTS AT met.no. Observations. Intranet verification portal. Model output. Quba databases. Verification by email. Quba Editor. Forecaster.

E N D
Verification tools at the Norwegian Meteorological Institute By Helen Korsmo EGOWS 2004
PRODUCTION AND VERIFICATION OF POINT FORECASTS AT met.no Observations Intranet verification portal Model output Quba databases Verification by email Quba Editor Forecaster VePS Verification Presentation System Newspapers TV www.met.no
Production of point forecasts - Quba • 3 regional offices produce forecasts for a total of about 140 locations with Quba editor. • One central production database for subjective forecasts, model output and observations. • Forecasters log on to the database, personal verification is possible. • All data copied to separate historical database for verification purposes.
Quba editor Weather, temperature, and wind forecasts edited on the map or in tables. Bidirectional communication with the database.
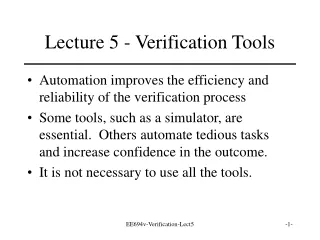
Why verify? The three most important reasons to verify forecasts are: • to improve forecast quality - the first step toward getting better is discovering what you're doing wrong. • to compare the quality of different forecast systems - to what extent does one forecast system give better forecasts than another, and in what ways is that system better? • to monitor forecast quality - how accurate are the forecasts and are they improving over time? (from http://www.bom.gov.au/bmrc/wefor/staff/eee/verif/verif_web_page.htm)
Verification at met.no • Daily batch jobs producing • verification results for the intranet • personal verification – sent automatically by email • VePS user interface is under development • Verification of models and of subjective forecasts. • Meteorologists can learn how they perform compared to the models and which models are best to use as a starting point.
The intranet verification portal Verification results for the following parameters are updated daily and are available on our intranet:Temperature, wind, cloud cover, precipitation, weather symbol and geopotensial height.Timeseries and tables of observed values versus NWP model forecasts and subjective forecasts, as well as computed MAE,RMS and BIAS values are available for most synop stations.
Personal verification by email Every day the forecaster that made the forecast receives an email comparing his or hers subjective temperature forecast with observations and with various NWP models. |∆T|≤ 1 ºC 1 point |∆T| ≤ 2 ºC 1/2 point |∆T|> 2ºC 0 points A grade is calculated from the ratio of total score to the maximum possible. The same is done for the NWP forecasts so the forecaster can compare how well he is doing compared to the models, where he could improve etc. The scores are only available to the forecaster that made the forecast and are not meant for the bosses…
VePS –Verification Presentation System • Graphical user interface to produce verification results on demand. • Forecasts and observations read from the Quba historical database in real time. • Forecasters log in to check their own verification results. • Timeseries, contingency tables, scatterplot, geographical distribution produced according to user spesifications. • The system is connected to the meteorological workstation Diana,where the verification results are displayed on the map.
Map dialog(1) Forecasted/observed weather symbol
Map dialog(2) Temperature bias for a chosen period
Verification in Quba Editor Verification results for each station is produced twice a day. Show how the previous forecast performed, + statistics (RMS,bias,MAE). Info is shown while forecast for this station produced.
Future plans • 2004 • Scatterplots and contingency tables will also be available in VePS. • 2005-2006 • Verification of text forecasts: Today one of our most important product is the text forecasts, which is not verified. A text forecast editor/generator will be made, which renders the text forecasts more verifiable.