Download
1 / 32
320 likes | 562 Views
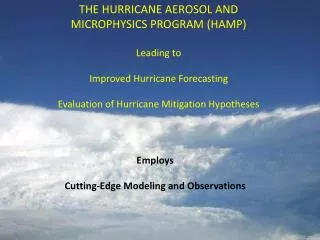
THE HURRICANE AEROSOL AND MICROPHYSICS PROGRAM (HAMP) Leading to Improved Hurricane Forecasting Evaluation of Hurricane Mitigation Hypotheses. Employs Cutting-Edge Modeling and Observations. AEROSOLS ARE A VITAL COMPONENT OF ATMOSPHERIC PROCESSES

E N D
THE HURRICANE AEROSOL AND MICROPHYSICS PROGRAM (HAMP) Leading to Improved Hurricane Forecasting Evaluation of Hurricane Mitigation Hypotheses Employs Cutting-Edge Modeling and Observations
AEROSOLS ARE A VITAL COMPONENT OF ATMOSPHERIC PROCESSES Play a Prominent Role in the Global Climate Affect Cloud Microphysics and Dynamics (Increase Updraft Velocities, Change Drop-Size Distributions, Transform Some Tropical Clouds into Thunderstorms and Potentially Affect the Intensities and Tracks of Hurricanes) HAMP Addresses Cloud Microphysical Processes Explicitly
Small CCN aerosols have been known for 50 years to slow down the conversion of cloud water to precipitation. An experimental investigation of the effect of air pollution on the initiation of rain Gunn and Phillips, 1957: Journal of the Atmospheric Sciences, 14, 272-280
Growing Mature Dissipating Hail
The evaporative cooling of downdrafts may be even more important than the added latent heat of freezing. Lee S.S., L.J. Donner, J.E. Penner, 2010: Thunderstorm and stratocumulus: how does their contrasting morphology affect their interactions with aerosols? Atmos. Chem. Phys. Discuss., 10, 4305–4343 Growing Mature Dissipating Hail
weakening Invigoration of Increase in the TC wall radius convection on Height TC periphery Decrease in the Influx of mass and moisture 20 - 50 km 200 - 300 km Radial distance from the TC center A schematic of aerosol effects on the TC structure leading to TC weakening (Khain et al., 2009)
Spectral Bin Model (Khain et al., JAS, 2009): Low aerosol concentration Effects of continental aerosol included 16 mb! 27.00 Z 28:00 Z 29:00Z 30:00 Z Figure 2. Time dependence of minimum pressure in numerical experiments and hurricane Katrina (August 2005)
Aerosol influences on deep convection and tropical cyclonesCotton et al., J. Weather Modification, 2007 Clean – 100 cm-3 Polluted – 1000 cm-3 Double – 2000 cm-3 Simulated storm intensity decreased with increasing CCN concentration.
Cooling mainly due to evaporating cloud water. (Rosenfeld et al., 2007).
References for Hurricane Weakening • Cotton R.W, H. Zhang, G. McFarquhar, and S, M. Saleeby, 2007: Should we consider polluting hurricanes to reduce their intensity? J. Wea. Mod., v.39, 2007, p. 70. • Khain, A. N. Cohen, B. Lynn and A. Pokrovsky, 2008: Possible aerosol effects on lightning activity and structure of hurricanes. J. Atmos. Sci. 65, 3652-3667. • Khain A., B. Lynn, and J. Dudhia, 2009: Aerosol effects on intensity of landfallig hurricanes as seen from simulations with WRF model with spectral bin microphysics. J. Atmos. Sciences, submitted. • Rosenfeld D., A. Khain, B. Lynn, W.L. Woodley, 2007: Simulation of hurricane response to suppression of warm rain by sub-micron aerosols. Atmos. Chem. Phys., 7, 3411-3424. • Zhang, H., G. M. McFarquhar, W. R. Cotton and Y. Deng, 2009: Direct and indirect impacts of Saharan dust acting as cloud condensation nuclei on tropical cyclone eyewall development. Geophys. Res. Lett., 36, L06802, doi:10.1029/2009GL037276. • Zhang, H., G. M. McFarquhar, S. M. Saleeby, and W. R. Cotton, 2007: Impacts of Saharan dust as CCN on the evolution of an idealized tropical cyclone. Geophys. Res. Lett., 34, L14812, doi:10.1029/2007GL029876.
Aerosol weakening effects on hurricanes may help explain forecast model overestimates of hurricane intensities Michal Clavner (1), Daniel Rosenfeld (1), Ronit Nirel (2) • Institute of earth Sciences, The Hebrew University of Jerusalem, Israel • Department of Statistics, The Hebrew University of Jerusalem, Israel • Presentation by William L. Woodley, President • Woodley Weather Consultants, Littleton, Colorado
The Hypothesis • CCN aerosols weaken hurricanes • GFDL hurricane predictions do not account for the aerosol weakening effect. • Therefore, greater amounts of aerosols would decrease the actual hurricane intensity with respect to its prediction. • This would explain overestimates in the prediction errors for polluted hurricanes, which would be greater with more CCN aerosols ingested by the storm.
Data sets used in this study Automated Tropical Cyclone Forecast (ATCF) database, NOAA, provides: The official intensity of each hurricane, represented by the observed maximum sustained wind velocities The Geophysical Fluid Dynamics Laboratory (GFDL) 12 hour forecast for the maximum wind velocities The Goddard Chemistry Aerosol Radiation and Transport (GOCART) model, provides: Aerosol Optical Thickness (AOT) for Dust, Organic Carbon, Black Carbon, Sulfate and Sea Salt. NCEP/NCAR reanalysis, provides: Precipitable water (humidity)
GOCART Model Data sets used in this study: • The GOCART NASA/GSFC model has a horizontal resolution of 2º latitude by 2.5º longitude and uses the assimilated meteorological fields generated from the Goddard Earth Observing System Data Assimilation System (GOES DAS).It contains the following modules in aerosol simulation: emission, chemistry, advection, boundary layer turbulent mixing, moist convection, dry depositions and wet depositions (Chin et al., 2002). • The aerosol optical thickness, AOT, available from GOCART are for: • Dust • Black Carbon (BC) • Organic Carbon (OC) • Sulfate • Sea Salt. • The AOT is unitless and averaged daily.
The dependent variable: the prediction Error • The model prediction error of the maximum wind speed dVmaxis defined by the observation Vmax(observed)subtracted from the prediction Vmax(predicted) every 6 hours during the hurricane life cycle: • The GFDL forecast for lead time of 12 hours was chosen, because it was considered to be the most accurate forecast, while already not constrained too much by the observed intensity at the initial time. • The forecast is recalculated every 6 hours, therefore, the data set is constructed of the 12-hour forecast errors, recalculated every 6 hours. dVmax = Vmax(observed) – Vmax(predicted)
The dependent variable: the prediction Error • The model prediction error of the maximum wind speed dVmaxis defined by the observation Vmax(observed)subtracted from the prediction Vmax(predicted) every 6 hours during the hurricane life cycle: dVmax = Vmax(observed) – Vmax(predicted) • If aerosols weaken hurricane intensity, we expect that with added aerosols we will get lower Vmax(observed) for the same Vmax(predicted). • This means lower dVmax for more Aerosol Optical Thickness (AOT). • We expect dVmax and AOT to be negatively correlated.
The explaining variables: the aerosols AOT The GOCART calculated aerosol species at a radius of 250 km from the center of the hurricane or tropical storm. Dust Black Carbon (BC) Organic Carbon (OC) Sulfates Sea Salt NCEP/NOAA Reanalysis: Precipitable water
BC: Black Carbon AOT DU: Dust AOT OC: Organic Carbon AOT PW: Precipitable Water (mm) SS: Sea Salt AOT SU: Sulfate AOT Dependence of dVmax on the explaining variables
Sea salt depends on Vmax. Therefore sea salt is positively correlated with dVmax. • Sulfate is also positively correlated with Vmax. Therefore, Sulfate cannot serve as an explanatory variable • GOCART: “Oceanic emission of dimethyl sulfide (DMS), which is the most abundant volatile sulfur compound in seawater, is calculated based on the surface seawater concentrations of DMS and 10-m winds over the ocean using an empirical formula.”
Precipitable water decays with more dust! Is dust just a marker of the drier air that weakens the hurricanes?
A method to try to single out the effect of the dust on the hurricane's intensity is dividing the data into groups of similar precipitable water values.Then, examine the effect of the dust aerosol quantity on the hurricane's maximum wind velocity forecast error in each subgroup.
The data set was divided into pentades of precipitable water
A similar effect of dust on the prediction error was found within all the PW pentads Weakening of hurricanes can be explained by dust itself and not due to its association with dry air
Interim conclusions: • Sea Salt and sulfates cannot serve as explanatory variablesGreater amounts of sea salt and sulfates mean greater wind speeds, and hence sea salt must be positively correlated with dVmax, but being the outcome and not the cause of the prediction error. • Dust aerosols are not just a marker for dry air, but rather affect the hurricanes directly • No dependence of PW was found for the effectiveness of dust on dVmax. • Black Carbon and Organic Carbon do not mark dry airBlack carbon and organic carbon are slightly positively correlated with the precipitable water, so that they could not be a marker for the suppressive effect of dry air.
The statistical Model • The data set in this study includes 51 hurricanes which occurred between the years 2001 till the end of 2007, which is sufficiently large to produce statistical results with high significance levels. • Each hurricane is a different sequence, and therefore, is independent from the other hurricanes. • Each hurricane consists of data points spaced at time intervals of 6 hours. The dataset includes 1690 such data points. • The dVmax prediction errors within each hurricane are regarded as a time series of measurements for that hurricane, having serial autocorrelation. A standard linear regression model cannot be used in this study, because the observations within a hurricane are not completely statistically independent.
Y X e vector of outcome variable Matrix of explanatory variables vector of treatment fixed effect parameters vector of experimental errors, having a specified autocovariance matrix Multiple Linear Regression Model for Repeated Measures A repeated measurements model will be used because it allows the capability to specify the correct covariance structure. This capability is implemented in the PROC MIXED procedure of the SAS System.
Statistical Model The Validity of the model to the data: Running the model on the data showed that the residuals were not normally distributed and were heterogeneous. These findings violate the assumptions of the Multiple Linear regression model. Step 1: In order to solve the distribution problem of the residuals, the outliers of the dependent variable, dVmax, were excluded from the data set. There are 14 points out of 1690 ( ~0.83% of the data set) which are considered to be outliers. Their values were off the mean by more than 3 standard deviations. Step 2: A log transformation on the explanatory variables helped to solve the Heteroscedasticity (conformity with the linear regression requirements) problem.
Statistical Model Results The SAS model output without transforming the explanatory variables to the natural logarithm ( linear relationship)
Dividing the data set according to years: Has model gotten more accurate over time, and therefore, the latest model output errors can be attributed more to the aerosols and less to other factors?
Conclusions • The hypothesis that dust weakens hurricanes is supported. • Air pollution aerosols, as represented by organic carbon, are much more potent than desert dust in weakening hurricanes for the same AOT. • Black carbon appears very potent in enhancing hurricanes! • The significant and strong indicated effects mean that there is a potential for substantial improvement in forecasting hurricane intensity by incorporating the microphysical and radiative effects of aerosols into the hurricane prediction models. • This also means that hurricane modification is feasible, and that we are likely already doing it inadvertently. • If so, it behooves us to study it thoroughly!
Recommendations Repeat the Study Using the SHIPS Model Output after Consultation with NOAA Personnel Need Real-Time Estimates of AOT Enhance NOAA cooperation with DHS HAMP effort for improved forecasts: • Coordinate and support P3 flights for sorely needed cloud physics measurements. • Link the HAMP and HFIP modeling efforts, e.g., by making the HAMP detailed model available as a benchmark for the prediction model. • Have a NOAA liaison to HAMP.