QoP
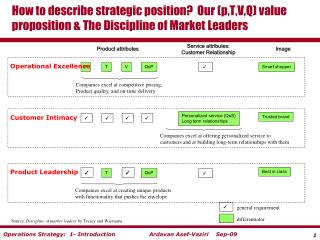
How to describe strategic position? Our (p,T,V,Q) value proposition & The Discipline of Market Leaders. Service attributes: Customer Relationship. Product attributes. Image. Operational Excellence. P. T. V. QoP. ✓. Smart shopper. Companies excel at competitive pricing,

QoP
E N D
Presentation Transcript
How to describe strategic position? Our (p,T,V,Q) value proposition & The Discipline of Market Leaders Service attributes: Customer Relationship Product attributes Image Operational Excellence P T V QoP ✓ Smart shopper Companies excel at competitive pricing, Product quality, and on-time delivery Personalized service (QoS) Long term relationships Customer Intimacy Trusted brand ✓ ✓ ✓ ✓ Companies excel at offering personalized service to customers and at building long-term relationships with them Product Leadership Best in class ✓ ✓ T QoP ✓ Companies excel at creating unique products with functionality that pushes the envelope ✓ general requirement differentiator Source: Discipline of market leaders by Treacy and Wiersema
A Balanced Scorecard Map • Balanced scorecard measures a company's performance in: market, operations, learning and growth, and finance. • The map can be used relate an operations strategy with the firm's financial and competitive strategy. The balanced scorecard tends to emphasize the learning and growth view and represents earlier innovation lever as a separate view. The financial view specifies how the organization seeks to increase its NPV. The two financial levers are to increase revenues or decrease costs. The growth strategy must define its desired balancing point between emphasizing productivity or revenue growth.
A balanced scorecard map Value Proposition Market View Competencies Operations Strategy Operations View Resources Processes Innovation Learning & Growth View Growth Strategy Financial View x Productivity Revenue NPV
Four Perspectives 0f The Balanced Scorecard • Financial Perspective • Customer Perspective • Process Perspective • Learning and Growth Perspective (Infrastructure)
Financial Perspective • Revenue Growth • Increase amount of new products • Pricing strategy • Cost Reduction • Reducing cost • Asset Utilization • Improvement
Increase Market Share Increase Customer Retention Increase Customer Acquisition Increase Customer Satisfaction Increase Customer Profitability Performance Value: Product quality Post-purchase Price Customer Perspective
Innovation New products Cycle time Operations Quality Time Post-sales Service Service Quality Service Efficiency Process Perspective
Employee capabilities Information Technology capabilities Employee attitudes Motivation Empowerment Alignment Learning and Growth Perspective
Balanced scorecard is a collection of critical performance measures derived from a company’s vision, strategy, and objective. Performance measures should be integration of outcome and lead measures. Lead measures are performance drivers which makes things happen while outcome measures are indicators of results. Cause and Effect relationship between outcome and lead measures leads all scorecard measures to be linked by same relation. Linking Measures to Strategy What is measured is done…..
Testable strategy is defined as a set of linked objectives aimed at an overall goal. It is achieved by restating the strategy into set of cause-and-effect hypotheses that are expressed by a sequence of if-then statements. Testable Strategy Increase shareholders value Decrease Process Cost Increase Profits Increase Revenue Financial Improve Delivery Reliability Increase Customer Retention Increase Market share Customer Improve Cycle time Redesign Process Process Learning & Growth Improve Employee skills
Cause-and –effect structure indicates that viability of strategy is testable. If desired results are not achieved through balanced scorecard it may indicate: - Implementation problem. - Invalid strategy. Double loop feedback – validity of assumptions underlying the strategy and effectiveness of strategy implementation. Strategic Feedback
Strategic Alignment Creating Implementing 1 Communicating Targets & Incentives 2 Resource Allocation 3
Communicating Strategy 1 Targets & Incentives 2 Targets Incentives It must be structured to support the strategy. Financial E.g.: Increase Profits, Revenues Learning Growth E.g.: Improve Employee Skills Customer E.g.: On –Time Delivery Internal Process E.g.: Improve Cycle Time