Download
1 / 20
200 likes | 403 Views
Intro Stats Warm – Up 1.3 Determine the Level of Measurement of each (nominal, ordinal, interval, ratio) 1. The daily high temperatures in a city. 2. The top 5 college football teams. 3. The list of colors available for a new corvette.

E N D
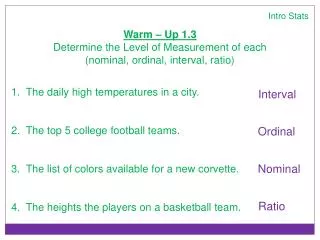
Intro Stats Warm – Up 1.3 Determine the Level of Measurement of each (nominal, ordinal, interval, ratio) 1. The daily high temperatures in a city. 2. The top 5 college football teams. 3. The list of colors available for a new corvette. 4. The heights the players on a basketball team. Interval Ordinal Nominal Ratio
Intro Stats Lesson 1.3 A Objectives: SSBAT classify different ways to collect data. Standards: S2.5B
Statistical Study • The goal is to collect data and then use that data to make a decision • Any decision made is only as good as the process used to obtain the data
Designing a Statistical Study Identify the variable(s) of interest and the population Develop a plan for collecting data (un-biased sample) Collect data Describe data using descriptive statistics 5. Interpret data, make decisions about the population using inferential statistics 6. Identify any possible errors
4 Ways to Collect Data • Observational Study • A person observes and measures characteristics of the population but does not change the environment at all. • Example: Researchers observed and recorded what children ages 0 – 3 years old did with nonfood objects • (watched if they put it in their mouths)
Perform an Experiment • Treatment is applied to part of a population and responses are observed. • You can also use a control group and a placebo. • Placebo: a harmless, unmedicated treatment, that is made to look like the real treatment • Example: Diabetics take a pill to see if helps reduce their risk of heart disease while a control group took a water pill.
3. Simulation • The use of a mathematical or physical model to reproduce the conditions of a situation or process • Saves time and money • Used for situations that may be too dangerous to do in real life • Example: Using dummies in an automobile to study the effect of crashes on humans.
4. Survey • Investigation of one or more characteristics of a population (interview, mail, telephone) • Surveys are most often carried out be people • Mostly done by interview, mail or telephone • Important to word the questions so that they do not lead to biased results.
Examples: State the method of data collection to use to collect data for each study. Observation, Experiment, Simulation, Survey. A study of the effect of changing flight patterns on the number of airplane accidents. Simulation A study of the effect of eating oatmeal to lower blood pressure. Perform an experiment
A study of how 4th grade students solve a puzzle Observation A study of U.S. residents’ approval rating of the U.S. President. Survey
Designing an Experiment • You need to make sure you produce Meaningful, Unbiased results • Experiment needs to be carefully designed and executed
3 Key Elements to a well designed experiment • Control • Randomization • Replication
Control Factors • Confounding Variable • Occurs when an experimenter cannot tell the difference between the effects of different factors on a variable. • Example: A coffee shop owner redecorates her store, at the same time a new shopping mall has it grand opening. • Which caused the increase in customers? • It’s too hard to decide.
Blinding A technique where the subject does not know whether he or she is receiving a treatment or a placebo. 3. Double Blinding Neither the subject nor the experimenter knows who received the placebo and who received the real treatment
Randomization • A process of randomly assigning subjects to different treatment groups. 3 ways this can be completed Completely Randomized Design - Subjects are assigned to different treatment groups randomly Blocks - Subjects are put into groups with similar characteristics Randomized Block Design - Subjects are put into groups with similar characteristics but then they are randomly assigned to treatment groups
All Subjects 30-39 Years Old 40-49 Years Old Over 50 Years Old Control Treatment Control Treatment Control Treatment Example of a Randomized Block Design
Replication • The repetition of an experiment using a large group of subjects (large sample sizes)
Identify a potential problem with each experiment. A company identifies ten adults who are heavy smokers. Five of the subject are given the new gum and the other five are given a placebo. After two months, the subjects are evaluated and it is found that the five subjects using the new gum have quit smoking. What is the potential problem with this experiment? The sample size is not large enough (10 people) to validate the results. It needs to be redone using a larger sample size.
Identify a potential problem with each experiment. 2. The company identifies one thousand adults who are heavy smokers. The subjects are divided into blocks according to gender. Females are given the new gum and males are given the placebo. After two months, the female group has a significant number of subjects who have quit smoking. What is the potential problem with this experiment? The groups are not similar. The gum may have a greater effect on women than men, or vice versa.
Homework Page 25 #1, 4, 11 – 14 All