Download
1 / 49
490 likes | 615 Views
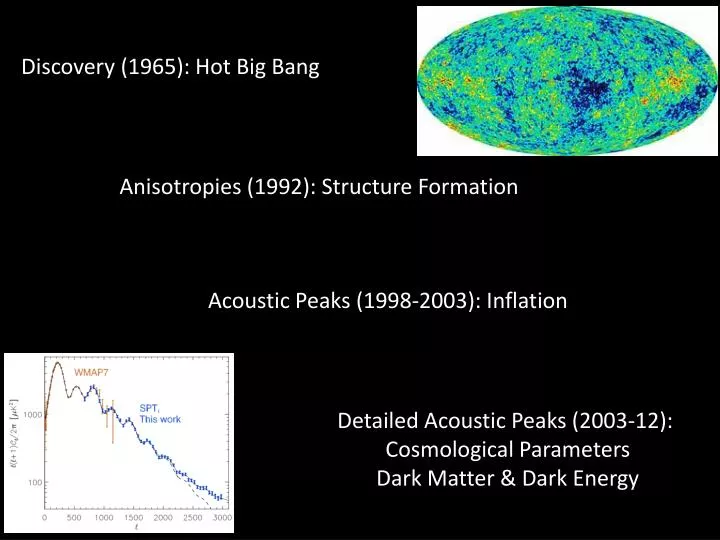
Discovery (1965): Hot Big Bang. Anisotropies (1992): Structure Formation. Acoustic Peaks (1998-2003): Inflation. Detailed Acoustic Peaks (2003-12): Cosmological Parameters Dark Matter & Dark Energy. Why peaks and troughs?.

E N D
Discovery (1965): Hot Big Bang Anisotropies (1992): Structure Formation Acoustic Peaks (1998-2003): Inflation Detailed Acoustic Peaks (2003-12): Cosmological Parameters Dark Matter & Dark Energy
Why peaks and troughs? • Vibrating String: Characteristic frequencies because ends are tied down • Temperature in the Universe: Small scale modes begin oascillating earlier than large scale modes
Puzzle: Why are all modes in phase? Power on a given scale is averaged over multiple modes with same wavelength. We implicitly assumed that every mode started with zero velocity.
If they do all start out with the same phase … First peak will be well-defined Clumpiness Time/(400,000 yrs)
As will first trough ... And all subsequent peaks and troughs Clumpiness Time/(400,000 yrs)
If all modes are not synchronized though First “Trough” First “Peak” Clumpiness Clumpiness Time/(400,000 yrs) Time/(400,000 yrs) We will NOT get series of peaks and troughs!
Coherent Peaks and Troughs Evidence for Inflation Keisler et al. 2011
Evidence for New Physics • Total matter density is much greater than baryon density non-baryonic dark matter • Total matter density is much less than total density dark energy
Discovery (1965): Hot Big Bang Anisotropies (1992): Structure Formation Acoustic Peaks (1998-2003): Inflation Detailed Acoustic Peaks (2003-12): Cosmological Parameters Dark Matter & Dark Energy What’s next?
What’s Next? • Physics Driving Inflation • Neutrino Masses and Abundances • Nature of Dark Energy
Non-Gaussianity Current observations WMAP SDSS Smith, Senatore, & Zaldarriaga (2009)Slosar et al. (2008) Upcoming observations Planck DES If local NG is found in the next decade, single field models of inflation will be falsified
Dozens of experiments going after B-modes QUIET: Araujo et al. 2012
Gravitational Waves Elsewhere Primordial Gravitational Waves also produce lensing B-modes. B-mode lensing (call it ω) spectrum peaks on the largest scales* Noise Estimate Scalar leakage GW wave signal Dodelson, Rozo, & Stebbins (2003) Sarkar et al. (2008) Dodelson (2010) Masui & Pen (2010) Book, Kamionkowski, & Schmidt (2011) *Might be good way to test for bubble collisions predicted by eternal inflation
Gravitational Waves Elsewhere The same gravitational wave that sources polarization after reionization also transforms the shapes of galaxies: these two signals are correlated!
Cross-Correlation is non-negligible Depends on l and redshift of source galaxies; might devise weighting scheme to optimize signal. Detection would eliminate systematics.
Effect of adding extra neutrinos (Hou et al. 2011) • H-1goes down • Ratio of damping scale to sound horizon goes up • Sound horizon is fixed so damping scale goes up, gets larger • Suppression kicks in at lower l • Power spectrum in the damping tails goes down
Power in the Tail of the CMB is (a little) low Keisler et al. 2011
Current Constraints SPT favors high Neff (as do other small scale CMB expeirments)
Preliminary SPT Spectrum Look for tighter neutrino constraints and constraints on n’
Secondary Anisotropies kSZ: Reionization Thermal SZ: Clusters, LSS Cosmic Shear Cluster Lensing Scattering off electrons Gravitational Lensing
Lensing of the CMB CMB photons from the last scattering surface are deflected (~few arcminutes) by coherent large scale structure (~few degrees) Effect is not as dramatic in real maps, but estimators of non-Gaussianity extract projected gravitational potential Hu 2002
Lensing of the CMB Primordial unlensedtemperature Tuis re-mapped to where the deflection angle is a weighted integral of the gravitational potential along the line of sight
Lensing of the CMB Consider the 2D Fourier transform of the temperature where Now though different Fourier modes are coupled! The quadratic combination would vanish on average w/o lensing. Because of lensing, it serves as an estimator for the projected potential
Lensing of the CMB ACT, a high resolution experiment, has detected lensing of the CMB and estimated the power spectrum of the lensing structures Atacama Cosmology Telescope Das et al. 2011 Matter-only model predicts more structure
Lensing of the CMB Lensing amplitude + primary acoustic peak structure provide evidence for acceleration from the CMB alone at 3.2 sigma Sherwin et al. 2011
Van Engelen et al 1202.0546 South Pole Telescope has detcted this at > 6-sigma
Difference between massless spectrum and one with 0.1 eV Planck and then ACTPol & SPTPol will make 30- or 40-sigma detections within the next few years. We are approaching the lower limit of 0.05 eV! Hall & Challinor 2012
Clusters and Dark Energy • Cluster abundance depends on geometry (volume as function redshift) and growth of structure (exponentially sensitive to σ8): excellent probe of Dark Energy • Key Systematic: Mass Calibration • CMB can help by observing: Thermal SZ Effect (Small scatter between mass and SZ signal) and CMB-Cluster Lensing (Direct determination)
Sunyaev-Zel’dovich Effect 12.6 M pixels of 3.4’ size 13,823 Clusters in SDSS Challenge: Large WMAP pixels
Sunyaev-Zel’dovich Effect Non-parametric Average T in annuli around massive (blue) and less massive (red) clusters. Compare to predictions accounting for CMB noise. Result: smaller signal than expected Draper, Dodelson, Hao, & Rozo (2012)
Sunyaev-Zel’dovich Effect Parametric Use a template for the signal and fit for the free amplitude (matched filter). Signal smaller than predicted … in agreement with Planck Draper, Dodelson, Hao, & Rozo (2012)
Cluster-CMB Lensing Initial papers (Zaldarriaga 1999) pointed to distinctive signal: lensing a dipole. Hot side is slightly cooler since photons arrive from farther away; cool side is slightly hotter. Remove the dipole dimples
Likelihood Approach Amplitudes of lensing and SZ signal Data in pixel i SZ Template in pixel i with covariance matrix that depends on the deflection angle
Works well when using correct templates SPT parameters (beam, noise, sky coverage, cluster count) Baxter & Dodelson (2012)
Works less well when applied to independently generated mocks with different lensing templates and scatter Baxter & Dodelson (2012)
Conclusion • Inflation: Look for upcoming results on physics of inflation (B-modes, Non-Gaussianity, n’) • Neutrinos: Tantalizing results for Neff and capable of discovering inverted hierarchy • Dark Energy: • Evidence from CMB only • Will help propel clusters to viable DE probe
What can we do with this? Clean up B-mode contamination and measure even small tensor component Probe inflation even if energy scale is low Knox & Song; Kesden, Cooray, & Kamionkowski 2002
Non-Gaussianity: Large Scale Bias Local Non-Gaussianity corresponds to: Dalal et al. (2008) showed that this leaves a characteristic imprint on large scale structure
Non-Gaussianity: Large Scale Bias Critical density Consider the density field in 1D. A given region is collapsed (i.e. forms a halo) if the density is larger than a critical value. Long Wavelength mode
Non-Gaussianity: Large Scale Bias Add in short wavelength modes. For this one realization, the second peak has collapsed into a halo.
Non-Gaussianity: Large Scale Bias More generally, short wavelength modes drawn from a distribution with given rms (red curves) Halos more likely to form in region of large scale overdensity = bias
Non-Gaussianity: Large Scale Bias Change with primordial NG: more small-scale fluctuations in region of large scale over-density more bias on large scale
Non-Gaussianity: Large Scale Bias Slosar et al. (2009)
Non-Gaussianity Elsewhere Reionization proceeds more rapidly in NG models (Adshead, Baxter, Dodelson, Lidz 2012)
Non-Gaussianity Elsewhere May learn about inflation from surveys from infrared or 21 cm observations


![Charles Sheeler [1883 – 1965]](https://cdn0.slideserve.com/390605/charles-sheeler-1883-1965-dt.jpg)