Download
1 / 166
1.82k likes | 2.26k Views
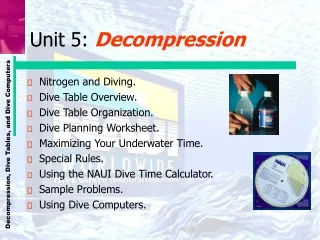
DIVE COMPUTERS 101. Dive Computers 101 is designed to provide divers with the theory, operation and benefits of multilevel diving with Oceanic Dive Computers. OBJECTIVES: Have A basic understanding of how Dive Computers work Understand the advantages of Dive Computers vs. dive tables

E N D
DIVE COMPUTERS 101 • Dive Computers 101 is designed to provide divers with the theory, operation and benefits of multilevel diving with Oceanic Dive Computers. • OBJECTIVES: • Have A basic understanding of how Dive Computers work • Understand the advantages of Dive Computers vs. dive tables • Understand the pre-dive setup, planning, underwater operation and post-dive features of a Dive Computer • Determine which Dive Computer features will best suit your type of diving
HOW A DIVE COMPUTER WORKS • Sensors send data to the Analog to Digital (A/D) Converter. • A/D Converter changes analog data to digital signals. • The Micro Processor calculates the data and presents it to the diver via the LCD Display.
COMPUTERS vs. TABLES • When using basic dive tables, the profile is based on the maximum depth reached for the total time of the dive. As a example: a diver performs a dive for a total time of 24 minutes and the deepest part of the dive was 88 feet. On every recreational dive table the depth will be rounded up to the next highest, in this case 90 feet. Even if the diver only spent 2 minutes of their dive at 88 feet and the rest of their dive at 30 feet the entire profile charts at 90 feet on a dive table.
COMPUTERS vs. TABLES • Diving Computers calculate a more accurate profile. They use the same (or similar) algorithms as the tables and simply perform those same calculations several times a second. Going back to the previous example, a Dive Computer would take into account that only 2 minutes were spent a 88 feet. It adjusts the no decompression dive time remaining, thus allowing additional bottom time.
COMPUTERS vs. TABLES • When used properly, diving computers are very safe. Because they automatically read the exact depth and duration at every point of the dive they can potentially reduce diver error. They also automatically time surface intervals as soon as a diver surfaces. Again, providing more accurate information which can benefit on repetitive dives. Over the course of a dive vacation a computer can safely add hours of available bottom time.
DIVE COMPUTER THEORY • OBJECTIVES: • Have A basic understanding of the Decompression Model utilized by Oceanic Dive Computers • Have a basic understanding of Tissue Compartments and how they are graphically represented on an Oceanic Dive Computer
DECOMPRESSION MODEL • Decompression theory can be trusted only as far as it has been demonstrated by actual test dive data. In 1987 Diving Scienceand Technology (DSAT) conducted a unique series of experiments. Commissioned by the Professional Association of Diving Instructors (PADI), these Doppler ultrasound monitored human experiments conducted by Dr. Michael Powell produced the most comprehensive data set that exists for recreational divers to this day. These data were used to validate the PADI Recreational Dive Planner and are the basis of the algorithm used in all Oceanic Personal Dive Computers (PDCs).
DECOMPRESSION MODEL • The programs within an Oceanic PDC simulate the absorption of nitrogen into the body by using a mathematical model. This model is merely a way to apply a limited set of data to a large range of experiences. The Dive Computer model is based upon the latest research and experiments in decompression theory.
DECOMPRESSION MODEL • Still, using an Oceanic PDC, just as using the dive tables, is no guarantee of avoiding decompression sickness. • Every diver’s physiology is different, and can even vary from day to day. No machine can predict how your body will react to a particular dive profile.
MULTIPLE TISSUE TRACKING • An Oceanic PDC tracks twelve tissue compartments with halftimes ranging from 5 to 480 minutes. The Tissue Loading (Nitrogen) Bar Graph provided on most Oceanic PDCs always displays the controlling compartment that is the only one important at that time. • Think of the Tissue Loading (Nitrogen) Bar Graph as twelve separate transparent displays laid on top of one another. The tissue compartment that has filled up fastest is the only one the viewer can see from the top.
MULTIPLE TISSUE TRACKING • At any particular point, one tissue compartment may be absorbing nitrogen, while another that was previously higher may be off-gassing. • NOTE: This feature of the Decompression Model is the basis of multilevel diving, one of the most important contributions that an Oceanic PDC offers you.
FEATURES & DISPLAYS • OBJECTIVES: • Be able to identify numeric and graphic displays of the Veo 100 Nx • Understand the function of the Control Button • Identify and understand the information presented via bar graphs • Identify and understand low battery power condition displays
FULL DISPLAY • Each numeric and graphic display represents a unique piece of information. It is imperative that you understand the formats, ranges, and values of the information represented to avoid any possible misunderstanding that could result in error.
CONTROL BUTTON • The Control Button allows you to select display options and access specific information when you want to see it. • It is also used to enter settings.
TISSUE LOADING BAR GRAPH • The Nitrogen Tissue Loading Bar Graph represents tissue loading of nitrogen, showing your relative no decompression or decompression status. • The Tissue Loading (Nitrogen) Bar Graph offers you a convenient way to consistently monitor how close you are coming to the No Decompression Limit.
TISSUE LOADING BAR GRAPH • As your depth and elapsed dive time increase, segments will add to the Graph, and as you ascend to shallower depths, the Bar Graph will begin to recede, indicating that additional no decompression time is allowed for multilevel diving.
TISSUE LOADING BAR GRAPH • The Tissue Loading Bar Graph monitors 12 different nitrogen compartments simultaneously and displays the one that is in control of your dive. It is divided into a No Decompression (normal) zone, a Caution zone (also No Decompression), and a Decompression (danger) zone.
TISSUE LOADING BAR GRAPH • Use the No Decompression Caution Zone as a visual reference to place a wider margin of protection between you and the No Decompression Limit. • Oceanic suggests that the Tissue Loading Bar Graph should always be in the No Decompression zone when leaving the water.
TISSUE LOADING BAR GRAPH • While you cannot provide a guarantee against the occurrence of decompression sickness, you may choose your own personal zone of caution based upon age, physique, excessive weight, etc., to reduce the statistical risk.
O2 ACCUMULATION BAR GRAPH • NOTE: Displays associated with oxygen and the O2 Bar Graph will only appear if FO2 has been set at a value other than “Air” (e.g., a numerical value).
O2 ACCUMULATION BAR GRAPH • The Oxygen Accumulation Bar Graph represents oxygen loading, showing the maximum of either per dive accumulated oxygen, or 24 hour period accumulated oxygen.
O2 ACCUMULATION BAR GRAPH • As your oxygen exposure (accumulation) increases during the dive, segments will add to the Bar Graph, and as loading decreases, it will begin to recede, indicating that additional exposure is allowed for that dive and 24 hour period.
VARIABLE ASCENT RATE INDICATOR • Most Oceanic PDCs are configured with a VARI or Variable Ascent Rate Indicator (bar graph) that shows how fast you are ascending. • The VARI provides a visual representation of ascent speed (i.e., an ascent speedometer).
VARIABLE ASCENT RATE INDICATOR • When you exceed the maximum ascent rate allowed for the depth you are at, the bar graph will enter the Alarm (Too Fast) Zone. • You will be alerted by all segments of the bar graph flashing which will stop when your ascent rate is slowed.
The segments of the Variable Ascent Rate Indicator represent two sets of speeds which change at a reference Depth of 60 FT (18 M). VARIABLE ASCENT RATE INDICATOR DEEPER THAN 60 FT (18 M) 0 SEGMENTS = 0-20 FPM (0-6 MPM) 1 SEGMENT = 21-50 FPM (6.5-15 MPM) 2 SEGMENTS = 51-60 FPM (15.5-18 MPM) 3 SEGMENTS = > 60 FPM (> 18 MPM) SHALLOWER THAN 60 FT (18 M) 0 SEGMENTS = 0-10 FPM (0-3 MPM) 1 SEGMENT = 11-25 FPM (3.5-7.5 MPM) 2 SEGMENTS = 26-30 FPM (8-9 MPM) 3 SEGMENTS = > 30 FPM (> 9 MPM)
DEPTH DISPLAYS • During a dive, the Current Depth display indicates depths from 0 to 330 FT (99.9 M) in 1 FT (0.1 M) increments.
DEPTH DISPLAYS • By accessing alternate Main Dive Displays, the Maximum Depth reached during that dive will be displayed in the center/left portion of the display.
DEPTH DISPLAYS • During a Decompression Dive, the required Ceiling Stop Depth is displayed in the center of the screen.
TIME DISPLAYS • The Main Time display is located in the lower portion of the display and a second time display is located in the center/right. • Both displays are identified by a clock icon. Time of Day can be set for 12 hour format (AM/PM) or 24 hour format.
TIME DISPLAYS • Time displays are shown in hour:minute format (i.e., 1:16 represents 1 hour and 16 minutes, not 116 minutes!).
NO DECOMPRESSION DIVE TIME REMAINING • No decompression Dive Time Remaining is the maximum amount of time that you can stay at your present depth before entering a decompression situation. • It is calculated based on the amount of nitrogen absorbed by hypothetical tissue compartments. The rates each of these compartments absorb and release nitrogen is mathematically modeled and compared against a maximum allowable nitrogen level.
NO DECOMPRESSION DIVE TIME REMAINING • Whichever one is closest to this maximum level is the controlling compartment for that depth. • Its resulting value will be displayed numerically along with the No Decompression Dive icon and graphically as the Tissue Loading Bar Graph.
NO DECOMPRESSION DIVE TIME REMAINING • The Dive Computer constantly monitors no decompression status and oxygen exposure. • The Dive Time Remaining display will indicate the time that is more critical for you at that particular moment (i.e.; whichever time is the least amount available).
POWER SUPPLY • The Veo 100 Nx utilizes one (1) CR 2450 Lithium cell that should provide 300 hours of continuous, or 50 activation periods, of operation. • If you conduct 1 dive each time the unit is activated, you should obtain approximately 50 dives. • If you conduct 3 dives each time the unit is activated, you should obtain approximately 150 dives.
POWER SUPPLY • A Battery Indicator provides an indication of battery condition. • When power is sufficient for normal unit operation, the Indicator will be displayed during Surface Mode. The Indicator will not be displayed during Dive Mode(s).
POWER SUPPLY • When 75% of the Rated Power has been consumed, the lower bar of the Battery Indicator (only segment) will be displayed, and the outline of the Indicator will flash once per second as a warning that the Battery is to be replaced prior to conducting any further dives.
POWER SUPPLY • Upon decreasing to a voltage level that will no longer sustain proper operation, the Indicator will flash 5 times followed by shutdown of the unit. • If a Low Battery condition exists when the unit is activated (by pressing the button), the graphic bAT and the Battery Indicator will appear flashing for 5 seconds followed by shutdown of the unit.
POWER SUPPLY • If the unit did not display a Low Battery Condition 'prior to‘ entering the Dive Mode, and a Low Battery Condition occurs during the dive, there will be sufficient battery power to maintain unit operation for the remainder of 'that dive'. The Battery Indicator will then appear after the dive upon entry into Surface Mode.
EXCERCISES USING THE PDC • Identify the following Display components: • Icon – Operating Mode • Icon – Descend Arrow/Deco Ceiling Stop Bar/Ascend Arrow • Graphic – Maximum PO2 • Tissue Loading Bar Graph • Graphic – Max Depth • Icon – Log Mode • Icon – Dive No. • Icon – Temperature • Graphic – depth • Variable Ascent Rate Indicator • Graphic – Ascent Too Fast • Icon – Time • Battery Indicator • O2 Bar Graph
EXCERCISES USING THE PDC • Identify the following Display components: • Icon – Operating Mode • Icon – Descend Arrow/Deco Ceiling Stop Bar/Ascend Arrow • Graphic – Maximum PO2 • Tissue Loading Bar Graph • Graphic – Max Depth • Icon – Log Mode • Icon – Dive No. • Icon – Temperature • Graphic – depth • Variable Ascent Rate Indicator • Graphic – Ascent Too Fast • Icon – Time • Battery Indicator • O2 Bar Graph
ACTIVATION & SETUP • OBJECTIVES: • Understand how to manually activate the Dive Computer • Understand how to access the Serial Number and Firmware Revision • Understand the Veo 100 Nx’s calibration and operation at high altitude • Understand the information displayed during the Surface Sequence • Access Set Mode and modify personal settings
ACTIVATION • To Manually Activate the Veo 100 Nx, press and release the Button. • Upon manual activation, the unit will enter Diagnostic Mode, displaying all segments of the LCD as 8's, followed by dashes (- -), then a countdown from 9 to 0. • Diagnostic Mode checks the display and Battery voltage to ensure that everything is within tolerance and functioning properly.
ACTIVATION • When the button is held depressed and the Diagnostic countdown reaches 00, a Serial Number screen appears displaying the unit’s Serial Number and firmware code Revision Number as long as the button is held depressed. Upon releasing the button, the unit shuts Off.
ACTIVATION • After manual activation, it will also check the ambient barometric pressure, and calibrate its present depth as zero. At elevations of 2,000 feet (610 meters) or higher, it will recalibrate itself to measure depth at that higher Altitude.
ALTITUDE COMPENSATION • Atmospheric pressure decreases as Altitude increases above sea level. Weather systems and ambient temperature also affect barometric pressures. Consequently, depth reading instruments that do not compensate for the decrease in ambient pressure indicate depth readings shallower than the depth they are actually at.
ALTITUDE COMPENSATION • The Veo 100 Nx automatically compensates for decreased ambient pressures for Altitudes between 2,000 (610 meters) and 14,000 feet (4,270 meters). Its program contains a high altitude algorithm that reduces no decompression and oxygen exposure limits to add a larger zone of caution. • The Veo 100 Nx senses ambient pressure when it is activated, every 15 minutes while it is activated, or every 30 minutes when it is not activated.