Download

1 / 21
210 likes | 301 Views
Learn about valuation using multiples, including P/E ratio, industry classification, price to EPS estimation, and forecasting techniques in corporate finance.

E N D
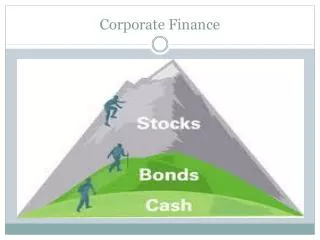
Corporate Finance Valuation Using Multiples: An Introduction (株価乗数、価格乗数、比較方式) N. Takezawa (ICU) 2002
Recall the balance sheet: Total Value = Liability Value + Equity Value V = E + D E=equity D=debt Liability Assets Equity N. Takezawa (ICU) 2002
Market Value • However, we are interested in the current market value of the firm (division or project). • Thus, we need the market value of equity as opposed to the “book” value of equity. • We also need the market value of debt. N. Takezawa (ICU) 2002
P/E in valuation • One popular method is valuation using multiples. • The P/E ratio is often used in the Multiples valuation. • P refers to the price per share of stock. E refers to the earnings the company makes. • If the P/E multiple is 10, this means that an increase inearnings by 1 yen is associated with a price increase of 10 yen (on average). N. Takezawa (ICU) 2002
Cont. • Multiples is just another term for scaling. • P/E is not the only scaling or multiples variable used. • Multiples involves several steps: choosing the right sample of firms, choosing the right multiples, projections for the firm in question. N. Takezawa (ICU) 2002
P/E Multiples valuation • Obtain the P/E for similar firms. Firms in the same industry, for example, with similar characteristics. • Average the P/E over the selected firms. The average gives us the (average) industry P/E multiple. • Multiply the forecasted earnings per share with the industry P/E multiple to obtain a forecast of the price. N. Takezawa (ICU) 2002
Choosing the firms to average • The selection criteria is very difficult to determine in practice: you need to understand the industry you are analyzing. • Outliers in general should not be included. • Too few firms, then one or two companies dominate the multiple. Too many companies then the sample may no longer be representative. N. Takezawa (ICU) 2002
Industry classification • Use of technology • Clients • Firm size N. Takezawa (ICU) 2002
Price EPS P/E Est. EPS Mar. 97 Mar. 98 Hitachi 1100 21 52.38 16 Matsushita 1920 36 53.33 39 Toshiba 690 19 36.31 19 (avg. P/E) 47.34 Sony 8640 105 82.28 86 Sony price = est. EPS x avg (P/E) = 86 x 47.34 = 4,071 This is the estimated price for March 1998 given information in 1997. N. Takezawa (ICU) 2002
Variations: Forecasted Earnings in Multiples • Use the forecasted P/E for each firm. In other words, use the estimated earnings, to obtain the average P/E. Since we are interested in the future (expectations) this is appropriate. N. Takezawa (ICU) 2002
Other Multiples • Multiples are not limited to P/E. Depending on the industry other multiples might be appropriate. Depending on the information you can obtain, you can probably calculate better scales. • Examples: Value/Sales, Value/EBIT, Price/number of chains, etc. N. Takezawa (ICU) 2002
Firm Sales Value- Value Sales Hitachi 11,392,500 4,126,419 2.76 Matsushita 5,970,915 6,794,852 0.88 Toshiba 4,031,798 5,265,138 0.76 (avg. value/sales) 1.46 Estimated sales for 98 is 6,100,000 (Sony), Debt = 2,482,296 6,100,000 x 1.46 = 8906,000 is estimated value Equity Value= 8,906,000 - debt = 6,423,704 6,423,704/374 = 17,175 (#shares outstand.=374) N. Takezawa (ICU) 2002
The value to sales ratio using 1997 figures for a larger set of firms is 0.97. Then, Sony’s price per share is about 9,800 for 1998. Firms include: Hitachi, Matsushita, Mitsubishi, NEC, Pioneer, Sanyo, Sharp, Toshiba. Thanks to R. Otsuka for assistance. N. Takezawa (ICU) 2002
Multiples • Notice that on the numerator we always have some number which reflects the value of the company: stock price, total market equity value, total firm value (enterprise value). • Denominator: a variable which drives the business and creates value: earnings, sales, number of chain stores,etc. N. Takezawa (ICU) 2002
Valuing Non-listed Firms and Divisions • The Sony example is simply to illustrate the procedure involved in multiples based valuation (relative valuation). • We use “comparable” firms for valuing companies which are not listed. • To value divisions of a firm we can use “comparable” companies as well. Companies with a single line of business (same line of business as the division). N. Takezawa (ICU) 2002
Recent Issues • How have internet industry firms performed (financially)? • Earnings positive? • Stock prices high? low? • Can we use a P/E multiple? • What multiples would you suggest? N. Takezawa (ICU) 2002
Multiples (価格乗数比較方式) • Difficult to use P/E multiples • Thus, analysts moved towards price-revenue ratios. Sales is relatively large and positive. • Use non-financial data in multiples analysis as done in other industries (chain stores, hospitals, etc.) N. Takezawa (ICU) 2002
Forecasting Revenues • Portals (gateway to internet) • Content/Community providers • E-tailors (sell goods/services on internet) • Analyst forecasts uniformly underestimate revenues. Average underestimate is 11%. Trueman, Wong, Zhang N. Takezawa (ICU) 2002
Web Usage Measures • Unique Visitors: number of different visitors who visit the firm’s web per month. • Pageviews: number of pages viewed by visitors per month. • Minutes: number of minutes spent on firm’s website per month. N. Takezawa (ICU) 2002
Cont. • For e-tailors, analyst forecast errors are correlated with all three web traffic growth measures. • Portal and content firms: analyst forecast errors correlated with unique visitor growth. • Web usage information provides additional forecast information on the margin. N. Takezawa (ICU) 2002