Download
1 / 79
790 likes | 989 Views
How to avoid common statistical mistakes: A behavior change workshop for researchers. Presented by Jeff Dang July 27, 2006. Academic Affiliation. Predoctoral Fellow UCLA Integrated Substance Abuse Program 11075 Santa Monica Blvd., Suite 200 Los Angeles, CA 90025 Tel: 310-312-0500

E N D
How to avoid common statistical mistakes: A behavior change workshop for researchers Presented by Jeff Dang July 27, 2006
Academic Affiliation Predoctoral Fellow UCLA Integrated Substance Abuse Program 11075 Santa Monica Blvd., Suite 200 Los Angeles, CA 90025 Tel: 310-312-0500 Fax: 310-312-0552 E-mail: jdang@mednet.ucla.edu
UCLA Office Senior Statistician Center for Neurobehavioral Genetics 760 Westwood Plaza, 47-706 NPI Los Angeles, California 90024 Tel: 310-206-1038 Fax: 310-206-4446 E-mail: jdang@mednet.ucla.edu
Personal Contact Information Statistical Consultant and Vice President Consulting Measurement Group 7071 Warner Avenue #F-400 Huntington Beach, CA 92647 E-mail: jdang@webcmg.com Tel: 866-STATS-99 ext. 6 Fax: 818-905-7768 Website: www.webcmg.com
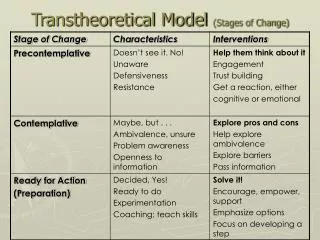
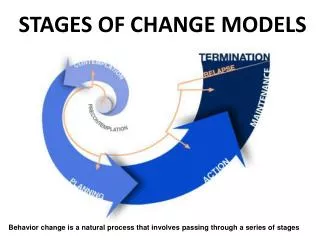
Relapse Prevention Model • Identify factors that contribute to relapse • Recognize your behaviors • Identify high-risk situations for relapse • Understand your triggers • Develop appropriate solutions • Anticipate problems and practice skills to overcome them
Objective • Provide a basic overview of common statistical mistakes • Identify situations that accentuate or trigger these habitual behaviors • Review some skills and learn some essential statistical techniques that can be used to improve statistical analyses
Outline • Modules of the intervention • Part 1: Understanding statistical error • Part 2: Common statistical mistakes • Part 3: A few statistical pet peeves • Part 4: Invalid presentation and interpretation of statistical results • Part 5: Advanced statistical techniques
A hate of math and statistics • Why is a clinician held in much higher esteem than a statistician? • A clinician makes an analysis of a complex illness whereas a statistician makes you ill with a complex analysis! • Statisticians often require more rigidity • Statisticians speak a different language • A statistician is a person who likes numbers but doesn’t have the personality it takes to be a CPA
Avoiding erroneous inferences • Type I error: = P (reject H0 | H0 is true) • You conclude that there is an effect when, in reality, there is not. • Analogous to a false positive • Type 1 errors are called alpha errors • Alpha levels are typically set be less than 5%.
Avoiding erroneous inferences • Type II error: = P (do not reject H0 | H0 is false) • You find no distinguishable effect but, in fact, the treatment was efficacious. • Analogous to a false negative • Type II errors are called Beta errors. • Beta levels are typically set to be less than 20%.
I’ve got the power • Power: 1- = P (rejecting the H0 / H0 is false) • The power to distinguish an effect when it is there. • You usually want a power of 80% or greater.
I’ve got the power • Power is closely related to . There is often some tradeoff. Increases in alpha increase power and decreases in alpha result in decreases in power. • Power is closely related to sample size. But there are diminishing returns after a certain point • Power is closely related to effect size. The larger the effect size the larger the power.
Common Behaviors • Brief review of behaviors provided by: • Greenhalgh, T. (1997). How to read a paper: Statistics for the non-statistician. II: "Significant" relations and their pitfalls. British Medical Journal, 315, 422-425. • Ten ways to cheat on statistical tests when writing up results
Fishing Expeditions • Run statistics on all variables • Run them every way possible • Exploratory analysis are often treated and described as confirmatory • If you torture the data long enough, eventually it will confess! • Sensitivity analyses are justifiable and should be described when carefully planned
Multiple Comparisons • Even confirmatory approaches and planned comparisons can require statistical adjustments for multiple comparisons • Sankoh, A. J., Hugue, M. F., & Dubey, S. D. (1997). Some comments on frequently used multiple endpoint adjustment methods in clinical trials. Statistics in Medicine, 16, 2539-2542.
Bias toward favorable results • Selective analytic decisions • Selective presentation of the results • File drawer problem noted in meta analysis research • Be careful not to use statistics to justify or support your hypotheses. • Be open to null results
Assuming Assumptions Hold • Assumptions about the assumptions: analytic techniques are robust to normality • When we conduct an examination of the assumptions, we to selectively go through and manipulate the data to support our hypotheses • Some statistical techniques are moderately robust when certain assumptions are violated (see Tabachnick & Fidell, 1996)
Example: Stat-L Consulting • A colleague of mine recently made the remark that there is no need to use nonparametric tests (regardless of how extreme the violations of normality) on a dataset when the groups have equal Ns • The equal variance assumption of the t-test is fairly robust when you have equal sample sizes
Use the appropriate test • "Transforming data to achieve a normal distribution (if this is indeed achievable) is not cheating: it simply ensures that data values are given appropriate emphasis in assessing the overall effect. Using tests based on the normal distribution to analyse non-normally distributed data, however, is definitely cheating.“ • Greenhalgh, T. (1997). How to read a paper: Statistics for the non-statistician. I: Difference types of data need different statistical tests. British Medical Journal, 315, 364-366.
Example: Nonparametric Statistics • The author looked at all articles published in Drug and Alcohol Dependence from December 1998 through December 2001 (volumes 53-65) in which the ASI was used. Of the 35 articles, 22 reported analyses on the composite scores and all used parametric tests (t test, analysis of variance, multivariate analysis of variance). • Delucchi, K. L., & Bostrom, A. (2004). Methods for analysis of skewed data distributions in psychiatric clinical studies: Working with many zero values. American Journal of Psychiatry, 161(7), 1159-1168.
Intent to treat analysis • Last value carried forward • This is used to preserve the benefits of RCT • Worse case scenario: Assume dropouts have negative outcomes to be conservative • Peto, R., Pike, M. C., Armitage, P., Breslow, N. E., Cox, D. R., Howard, S. V., et al. (1976). Design and analysis of randomized clinical trials requiring prolonged observation of each patient. I. Introduction and design. British Journal of Cancer, 34(6), 585-612.
Handling Missing Data • Listwise deletion is a common default • Mean replacement is implicit in many scales and often employed in research • Multiple imputation and FIML are better • Collins, L. M., Schafer, J. L., & Kan, C.-M. (2001). A comparison of inclusive and restrictive strategies in modern missing data procedures. Psychological Methods, 6(4), 330-351.
Multiple Imputation • Bayesian approach which allows auxiliary variables and easily run in free software • These variables do not need to be included in the analyses and can provide more accurate estimates • Consistent dataset across analyses • Schafer, J. L., & Graham, J. W. (2002). Missing data: Our view of the state of the art. Psychological Methods, 7, 147-177.
Association not Causation • Most researchers understand that models are not causal • The problem lies in overinterpretation of the data • Making inferences about the general population • Another problem is that we read a paper in a top tier journal and make clinical decisions based on it
Common triggers • Rushing to submit a grant, paper, or poster • Fail to consult with a competent statistical analyst • Making changes on the fly • Advanced techniques proposed for the grant but modify the analyses plan for publication • Fear of the ignorant reviewer: “They won’t understand it”
Obstacles to Recovery • Denial • Researchers do not want to admit that they make mistakes • Researchers become entrenched and wedded to ideas • Social and economic pressure • Publish or perish • Good research is time consuming
Don’t forget to check assumptions • All statistical models have assumptions • In ANOVA and regression, some assumptions are robust while other assumptions are not • Understand and check the assumptions of the model • If necessary, use a more appropriate model (i.e. nonparametric) or variable (i.e. transformation)
“The data have been cleaned” • Check data for coding or data entry problems • Run descriptive statistics to get acquainted with the data • Graph data • Too good to be true: Perfect data can indicate a problem (i.e. 100% follow up rate)
“I can fix it with statistics” • Research design and implementation is the key to good statistics • It is important to have a clearly defined conceptual framework and hypotheses • Make sure randomization, blinds, and controls are properly implemented
Power analysis • Many fail to do a power analysis, particularly in secondary data analysis • Budget determined sample sizes • Some researchers run a simple power calculation and then run more complex analyses that require larger sample sizes • Finding a study with the largest effect size to base your power analysis
Power analysis software • Sampsi module in STATA • One sample comparison of mean or proportion to hypothesized value • Two sample comparison of means or proportions • Repeated measures ANOVA accounting for correlations between time points • http://calculators.stat.ucla.edu/
Reliability • Nunnally is cited as support for Cronbach’s alpha of .70 or greater but what did he really say • Lance, C. E., Butts, M. M., & Michels, L. C. (2006). The sources of four commonly reported cutoff criteria: What did they really say? Organizational Research Methods, 9(2), 202-220. • Highly impacted by the number of items. • Cortina, H. M. (1993). What is coefficient alpha? An examination of theory and application. Journal of Applied Psychology, 78(1), 98-104.
Reliability • Recode reverse scored items, if not you can get a negative alpha • http://www.ats.ucla.edu/STAT/SPSS/library/negalpha.htm • SPSS and SAS codes are available to calculate the standard error for Cronbach’s alpha • Duhachek, A., & Iacobucci, D. (2004). Alpha's standard error (ASE): An accurate and precise confidence interval estimate. Journal of Applied Psychology, 89(5), 792-808.
Reliability • KR-20 for dichotomous, polychoric for interval • Look at the interitem correlations and item to total correlation • Average interitem correlations should fall between .15 and .50 • Briggs, S. R., & Cheek, J. M. (1986). The role of factor analysis in the development and evaluation of personality scales. Journal of Personality, 54, 106-148.
Psychometrics • Look at the scoring procedures carefully • Go beyond Cronbach’s alpha • Factor structure • Convergent validity • Discriminant valdity • Test-retest reliability • Use validated scales or conduct a thorough psychometric evaluation
Dichotomizing • Simulation data show that, for most cases, the effect size is decreased and there is a loss of power (i.e. need for a larger sample) as a result of dichotomization (i.e. median split) • However, a researcher must NOT assume that dichotomization will always result in a conservative estimate • MacCallum, R. C., Zhang, S., Preacher, K. J., & Rucker, D. D. (2002). On the dichotomization of quantitative variables. Psychological Methods, 7(1), 19-40.
Using Change Scores • Change score • Post minus pre (i.e. tx effect) as dependent variable • Employee rating minus supervisor rating (i.e. congruence) as independent variable • Use difference score to group individuals • Prompting the respondent to compare components via a mental calculus • Results in the same problems as the change score • Cognitive process may not be a simple subtraction
Using Change Scores • Why are they used? • Researcher believes that absolute difference score represents a totally new construct • Get significant results when they use them! • Analogy: Similar to testing an interaction without lower order terms in the model
Using Change Scores • Rethinking the approach • Two conceptually distinct constructs • Proximity between two constructs • Must have initial constructs as reference points • Benefits of multivariate techniques • Variance of the component scores are accounted for • Allow one or both of the components to be related to other variables • Power improves with repeated measures
Using Change Scores • References • Edwards, J. R. (1995). Alternatives to difference scores as dependent variables in the study of congruence in organization research. Organizational Behavior and Human Decision Processes, 64, 307-324. • Edwards, J. R. (2001). Ten difference score myths. Organizational Research Methods, 4(3), 265-287.
Better than RM ANOVA • Repeated measures ANOVA model assumes the measures over time are equally correlated with constant variance. • In addition, ANOVA models assume that subjects deviate by their "personal intercept" only. • It does not account for different slopes between subjects.
Better than RM ANOVA • These assumptions are problematic for psychiatric data because: • Measurements close in time are highly correlated • *Different covariance structures can be tested • Subjects are assumed to be similar at baseline • Subjects respond to treatment differently and variability increases overtime • Attrition is not random but related to treatment i.e. those who get better stop coming for treatment
Better than RM ANOVA • Reference • Gibbons, R. D., Hedeker, D., Elkin, I., Waternaux, C., Kraemer, H. C., Greenhouse, J. B., et al. (1993). Some conceptual and statistical issues in analysis of longitudinal psychiatric data: Application to the NIMH treatment of Depression Collaborative Research Program dataset. Archives of General Psychiatry, 50(9), 739-750.
Reporting Results • Reliance on p-values: • In large samples, small effects will be significant • If you predetermined criteria for what is acceptable then you cannot interpret a trend • Confidence intervals and effect sizes are highly advocated • Clinical significance should be discussed • Thompson, B. (2002). What future quantitative social science research could look like: Confidence intervals for effect sizes. Educational Researcher, 31, 25-32.
Example: Odds Ratio • Odds ratios are often interpreted as risk ratios • “X times higher risk” is not correct • Holcomb, W. L., Chaiworaponga, T., Luke, D. A., & Burgdorf, K. D. (2001). An odd measure of risk: Use and misuse of the odds ratio. Obstetrics and Gynecology, 98(4), 685-688.
Heuristics and the Eye Ball Test • Ocular Test: Examine the means and if they look different, declare it to be significant • Task: Based on the following figures when would you achieve a p-value of .05 • Looking for just significant