Download
1 / 23
230 likes | 352 Views
Urban Forestry and the Clean Water Act. David J. Nowak USDA Forest Service, Northern Research Station Syracuse, NY. Outline. I-Tree Hydro Chesapeake analyses. i-Tree - Hydro. Management model designed to be relatively easy to use

E N D
Urban Forestry and the Clean Water Act David J. Nowak USDA Forest Service, Northern Research Station Syracuse, NY
Outline • I-Tree Hydro • Chesapeake analyses
i-Tree - Hydro • Management model designed to be relatively easy to use • Object-oriented, physical based, semi-distributed, topographic model • TOPMODEL theory is used to simulate saturation excess overland flow (for forest area), base flow and ET process • Warm weather, semi-distributed urban soil-vegetation-atmosphere transfer scheme (SVATS) • C++ code with GIS inputs
i-Tree Hydro Strengths • Specifically designed to incorporate urban tree and impervious surface effects on stream flow and water quality • Built to simulate the dynamic forest interception, infiltration and ET processes as well as urban impervious effect on runoff generation. • Calibrated against measure stream flow data • Relatively easy to use
i-Tree Hydro Weaknesses • Lacks capabilities of fully-distributed model • Currently does not allow for specific locational designs of tree cover, impervious cover, or retention/detention ponds (operates on general cover types) • Works on watershed basis (with gauging station)
Model Inputs • Hourly discharge data (USGS) • Digital elevation map (USGS) • Hourly weather and evaporation data • Evaporation data calculated from weather data • Structural information on watershed (NCLD and i-Tree Eco (UFORE) data) e.g., • Tree cover • Impervious cover • Shrub and grass cover • LAI
Model Calculations • Topographic index with tree and impervious cover • Interception routine • Canopy parameters (throughfall, storage capacity, daily leaf and trunk area) • Depression storage (impervious) • Evaporation and transpiration from vegetation, soil and water surfaces • Infiltration into soils • Subsurface, overland and impervious runoff
Model Outputs • For each time step (1 hour for these simulations): • Canopy interception • Depression storage • Infiltration • Evapotranspiration • Surface and subsurface (base flow) runoff • Channel discharge (total runoff)
Water Quality • Separate program with inputs from i-Tree Hydro files • Multiple options that incorporate universal soil loss equation; buildup wash off routines • Currently only using EMC • Many other options need more input data • Dissolved sediment / solid pollutant load • Septic load • Dissolved pollutant concentration
Preliminary Model Results • Watersheds • Accotink (Washington, DC) • Baisman Run (Baltimore, MD) • Gwynns Falls (Baltimore, MD) • Mill Creek (Lancaster, PA) • Rock Creek (Washington, DC)
Baisman Run CRF1 = 0.56 CRF2 = 0.63 CRF3 = 0.70 Red – Observed; Black - Modeled
Baisman Run Canopy held at 70% Impervious held at 10%
Accotink CRF1 = 0.67 CRF2 = 0.56 CRF3 = 0.74 Red – Observed; Black - Modeled
Accotink – Storm Simulations 2 year storm 10 year storm 50 year storm
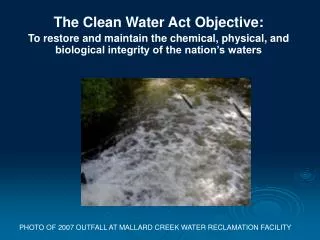
Water Policies – Total Maximum Daily Load (TMDL) • over 40% of our assessed waters still do not meet the water quality standards of the Clean Water Act • TMDL specifies the maximum amount of a pollutant that a waterbody can receive and still meet water quality standards • urban vegetation may help keeping urban waterways below TMDL limits
On-Going Work • Cross comparisons with Larry Band • 2005 and 2007 Pond Branch • Other watersheds across US