Download
1 / 37
370 likes | 497 Views
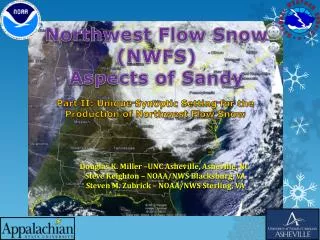
Northwest Flow Snow (NWFS) Aspects of Sandy. Douglas K. Miller –UNC Asheville, Asheville, NC Steve Keighton – NOAA/NWS Blacksburg, VA Steven M. Zubrick – NOAA/NWS Sterling, VA. Part II: Unique Synoptic Setting for the Production of Northwest Flow Snow.

E N D
Northwest Flow Snow (NWFS) Aspects of Sandy • Douglas K. Miller –UNC Asheville, Asheville, NC • Steve Keighton – NOAA/NWS Blacksburg, VA • Steven M. Zubrick – NOAA/NWS Sterling, VA Part II: Unique Synoptic Setting for the Production of Northwest Flow Snow
NWFS Aspects of Sandy4-part series • Part I: A General Overview of NWFS in the Southern Appalachians • Part II: A Unique Synoptic Setting for the Production of Northwest Flow Snow • Part III: Moisture Anomalies and Trajectory Analysis • Part IV: Radar and Satellite Observations
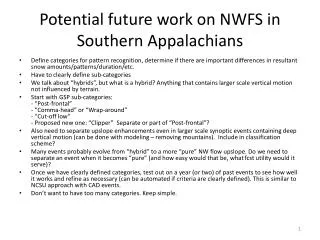
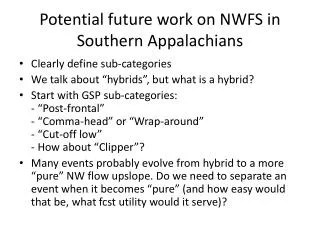
Outline • Northwest flow snow review • Synoptic classification scheme • Synoptic evolution of Sandy • Impacts of Sandy in the southern Appalachian Mountains • Contrast with “classic” NWFS case study • Research questions
Northwest Flow Snow Review (Part I) • NW low level winds (upslope component on western slopes) • Typically post-frontal, with absence of deep moisture and synoptic scale upward motion (in fact, large scale subsidence more common) • Shallow moist and unstable layer below deep stable layer • Cold air advection and cold enough temperatures in moist layer for good ice crystal growth • Localized heavy snowfall rates and significant accumulations can result in highly variable snowfall distributions
Synoptic Classification From Perry et al. (2013)
NWFS Aspects of Sandy4-part Series Fig. 2 of Perry et al. (2013)
Synoptic evolution of Sandy http://www.nasa.gov/mission_pages/hurricanes/archives/2012/h2012_Sandy.html
HPC Sea level pressure, 0000 UTC 29 Oct – 0000 UTC 1 Nov 2012
SPC 700 hPa analyses, 0000 UTC 29 Oct – 0000 UTC 1 Nov 2012 700 hPa level moisture? Mean 700-500 RH (%)
WRF-NMM 500 hPa level, 0000 UTC 29 Oct – 0000 UTC 1 Nov 2012
SPC 300 hPa analyses, 0000 UTC 29 Oct – 0000 UTC 1 Nov 2012 300 hPa jet structure?
Sandy storm track [Fig. 1 of Galarneau, Davis, and Shapiro (2013)] dt = 12-h
A hypothesis (Galarneau, Davis, and Shapiro 2013) • Diabatic heating on northwest flank of Sandy [~0000 UTC 28 October] and resulting upper-level divergent outflow; anti-cyclonic vorticity advection downstream of 500 hPa subtropical trough, impeding eastward progression of the overall 500 hPa trough • Allowed Hurricane Sandy to continue tracking northward rather than out to sea A prolonged period of northwesterly flow over the southern Appalachian Mountains
Impacts of Sandy in the southern Appalachian Mountains • Snow accumulation • Winds • Drifting snow • Mountain waves
Total snow accumulation associated with Sandy NWFS Aspects of Sandy4-part Series courtesy: Daniel Martin at Appalachian State University
Wind gusts (mph) NWFS Aspects of Sandy4-part Series courtesy: Daniel Martin at Appalachian State University
Sunrise on Mount LeConte, taken on Halloween Morning 2012. Snow drifts of 5 to 6 feet were reported at the lodge. Picture courtesy of Allyson Verden. slide courtesy of Sam Roberts and David Hotz
Fig. 1 of Perry et al. (2013) NWFS Aspects of Sandy4-part Series
RAP Skew-T analysis at Poga Mountain, 1200 UTC 30 Oct 2012 100 200 300 500 700 850 1000
Vertical cross section orientation 608 km, 129.75o
RAP θes [K] and ω [+ shaded, x 10-3hPa s-1], 1200 UTC 30 Oct 2012 Mountain wave slide, vertical cross section @ maturation KY SC Poga Mountain
Contrast with “classic” NWFS case study 26 – 28 February 2008 • 44-h duration • Surface low center located far from southern Appalachian Mountains
HPC Sea level pressure, 1200 UTC 27 February 2008 A comparison 0.54 inches
SPC 700 hPa analyses, 1200 UTC 27 February 2008 700 hPa level moisture? Mean 700-500 RH (%)
SPC 300 hPa analyses, 1200 UTC 27 February 2008 300 hPa jet structure?
Contrast with “classic” NWFS case study Poga Mountain observation comparisons • 0000 UTC 29 October – 1700 UTC 31 October 2012 (Sandy) • 2300 UTC 26 February – 1900 UTC 28 February 2008
Micro Rain Radar - Sandy dBZ 65-h duration 3 km Time (UTC) Doppler Velocity 1000 UTC 30 October 2012
Micro Rain Radar – 27 Feb 2008 dBZ 44-h duration 3 km Time (UTC) Doppler Velocity 1100 UTC 30 February 2008
Sandy A comparison 0.54 inches Precipitable water (in.) lowest 400 mb – 1200 UTC 30 Oct 2012
27 February 2008 A comparison 0.22 inches Precipitable water (in.) lowest 400 mb – 1200 UTC 27 Feb 2008
Study Conclusions Uniqueness of synoptic setting for northwest flow snow • Transitioning tropical system merging with a potent negatively-tilted mid-latitude synoptic-scale trough • Northwestward track of surface system resulting in westerly/ northwesterly flow of long duration (65-h) • Proximity of surface system to southern Appalachians leading to unusual snow and wind; high societal impact X Synoptic class:
Research Questions What is the source of the high density snow of the 29-31 October 2012 event? • Unusual air parcel trajectories? • Unique cloud microphysical processes?
Northwest Flow Snow Aspects of Sandy • Part I: A General Overview of NWFS in the Southern Appalachians • Part II: A Unique Synoptic Setting for the Production of Northwest Flow Snow • Part III: Moisture Anomalies and Trajectory Analysis • Part IV: Radar and Satellite Observations Questions? • Galarneau, T., C. Davis, and M. Shapiro, 2013: Intensification of Hurricane Sandy (2012) through Extratropical Warm Core Seclusion. Mon. Wea. Rev. doi:10.1175/MWR-D-13-00181.1, in press. • Perry, L.B., S. J. Keighton, L. G. Lee, D. K. Miller, S. E. Yuter, C. E. Konrad, 2013: Synoptic Influences on Snowfall Event Characteristics in the Southern Appalachian Mountains. Proceedings of the 70th Eastern Snow Conference, in press.