Download
1 / 24
240 likes | 377 Views
MODELING COMMERCIAL VEHICLE DAILY TOUR CHAINING. Jane Lin Ph.D., Associate Professor, Department of Civil and Material Engineering University of Illinois at Chicago SHRP 2 Freight Data and Modeling Symposium September 14, 2010. Study Scope And Definitions.

E N D
MODELING COMMERCIAL VEHICLE DAILY TOUR CHAINING Jane Lin Ph.D., Associate Professor, Department of Civil and Material Engineering University of Illinois at Chicago SHRP 2 Freight Data and Modeling Symposium September 14, 2010
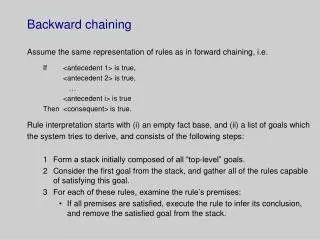
Study Scope And Definitions • The focus of this study is on urban/regional commercial vehicle movements as opposed to long-haul freight movements. • Urban commercial vehicle movements in this study include both goods and service deliveries. • Definitions: • Trip: travel between two consecutive stops, • Base Stop: a stop where a tour originates and terminates, which is typically a distribution center, a warehouse or the company office/garage where the vehicle belongs, • Tour: a tour is made when a vehicle makes one or multiple stops before returning to a base stop, • Daily Tour Chain: the entire movements of the commercial vehicle in a given day.
State-of-the-Art Urban Commercial Vehicle Modeling • Tour-based approach to modeling the underlying logistics of commercial vehicle tour strategies. • Tour-based strategies: Burns et al. (1985) • Direct: a vehicle ships separate loads directly to each customer without intermediate stops, • Peddling: a vehicle delivers to more than one customer per load, making multiple stops before returning to the base stop. • Good for smaller quantities of higher value items, larger truck capacity and higher customer density.
Tour-based strategies: Liu et al. (2003) Direct: suppliers operate independently Hub-and-spoke: consolidates from multiple suppliers and collectively delivers to customers. Other tour-based studies Holguin-Veras and Patil (2005) Trip chaining was characterized by # trips chained, length, and trip purpose Wang and Holguin-Veras (2008) Tour destination choice modeling Holguin-Veras and Thorson (2003) Empty trip modeling with a tour State-of-the-Art Modeling (cont’d) 4
Some Reflections on Tour-based Approach • Individual tour-based approach does not capture the interrelationship among linked tours (i.e., tour chain) and thus fails to incorporate tour chaining decisions and daily logistic planning. • Some studies found that almost one of four commercial vehicles made more than one tour per day (Holguin-Veras and Patil 2005) • The planning process of a single tour or linked tours during a daily operation involves many factors like customer demand, location, commodity type and shipment requirements, and logistics costs. • Among the existing urban commercial vehicle studies the authors have reviewed, very few looked at tour chaining patterns.
……… ……… (a) (b) (3) Multiple Direct with One/Multiple Base Location ……… ……… ……… (a) (b) (4) Multiple Peddling with One/Multiple Base Location ……… ……… ……… ……… ……… ……… ……… (b) (a) (5) Mixed with One/Multiple Base Location Base Location Stops (1) Single Direct (2) Single Peddling Observed Commercial Vehicle Daily Tour Chaining Strategies
Using the above tour chaining definition to understand the daily operations of urban commercial vehicles for both goods and service deliveries to investigate what characteristics of the delivery activity are associated with and possibly lead to a particular tour chaining strategy Research Questions and Objectives 7
Solicit urban commercial vehicle survey data Texas Commercial Vehicle Surveys in San Antonio, Amarillo, Valley, Lubbock and Austin during 2005 and 2006 Data exploration Daily tour chaining strategy choice model An individual tour-based choice model is also built using the same data and variables to test our hypothesis that tour chaining approach better captures the holistic decision on commercial vehicle daily operation. Research Approach 8
Texas Commercial Vehicle Surveys San Antonio, Amarillo, Valley, Lubbock and Austin in 2005 and 2006 A total of 13,802 trips made by 1,711 commercial vehicles.
Daily Tour Chaining Strategy Choice Model • After initial investigation, a multinomial logit model is found appropriate • Five alternative strategies: single direct, single peddling, multiple direct, multiple peddling, and mixed • Possible explanatory variables • Land use type • Cargo type • Trip purpose • Travel distance between stops • Average dwell time • Average cargo weight • Truck type • External trip • Socio-economic, demographic, and transportation statistics • Employment, Population, Household density, Median income, VHT, VMT, PMT, PHT in TAZ; etc.
Daily Tour Chaining Strategy Choice Model Result * Significant at 10%. ** Significant at 5%. *** Significant at 1%
Daily Tour Chaining Strategy Choice Model Result (cont’d) 15 * Significant at 10%. ** Significant at 5%. *** Significant at 1%
Summary Findings of Daily Tour Chaining Model • Single direct is less likely to be used for tours with pick-up assignments in non-base location or with closely located stops than other strategies. • Vehicles operating in a single direct strategy have longer dwelling time at stops than those in other strategies. • Single peddling is preferred for external trips and less attractive when shipping manufacturing products is involved. • Tours that involve shipments of Clay, Concrete, Glass, or Stone are more likely to operate in the multiple direct strategies, whereas those with shipments of miscellaneous products are less likely so. • Tours that include at least one stop at a distribution center tend to run in multiple peddling. • The use of the mixed strategies will increase if external trips are involved, and decrease if miscellaneous products shipments are involved.
A binary logit model is built Two alternative strategies: direct and peddling Same list of possible explanatory variables as seen previously only at the tour level Land use type Cargo type Trip purpose Travel distance between stops Average dwell time Average cargo weight Truck type External trip Socio-economic, demographic, and transportation statistics. Individual Tour-based Choice Model 17
Tour-based Choice Model Results * Significant at 10%. ** Significant at 5%. *** Significant at 1%
Summary Findings of Individual Tour Model • Negative constant suggests that direct pattern is generally preferred when no other information is available. • Consistent with the other model, direct tours are found to have longer dwell time than the peddling. • The chance of choosing peddling decreases if the minimum distance between stops or the average truck load per leg increases. • Peddling patterns are more likely to be associated with semi trucks or tours that visit a distribution center, a retail store, or an external location, involve miscellaneous or transportation goods, or travel to a TAZ with high household density.
Individual Tour-based versus Daily Tour Chaining Approach • Tour chaining models are able to capture the interrelated nature of individual tours in a vehicle’s daily operation • Individual tour model does not capture multiple-tour or mixed strategies, which are in many logistics are preferred strategies • Tour chaining model gives much more detailed insight to choice preference • External location is shown positively related to peddling in the individual tour based model and furthermore positively related to single peddling and mixed patterns in the tour chaining model • Shipments of miscellaneous products are likely to use peddling strategies but less likely so in a mixed strategy as suggested by the daily tour chaining model • Visits to distribution centers are not only strongly correlated with peddling strategies but more so with multiple peddling.
This study has presented an investigation of tour chaining based versus single tour based approach to understanding the complex process of urban commercial vehicle movements. The advantage of tour chaining model has been proven by comparing the individual tour and daily tour chaining models. Tour chaining reflects the interrelated decision process of linked trips. With mostly shipment related explanatory variables, this model would be useful in predicting future commercial vehicle daily tour patterns choice according to the changes of shipment demand in urban areas. Conclusions 21
There are several limitations associated with this study that require further research. Due to confidentiality, many critical variables (e.g., size, revenue, etc.) were not available to the study. Only the alternative specific variables were included in the model, and the absence of generic variables has restricted the model explanatory capability. Decisions of daily tour chaining vary by shipping companies. No information about shippers was available. Some of the real-world constraints and conditions were not included in the model: driver work hour regulations, availability and locations of rest stop in relation to the destinations for examples, are not being considered in the model. Since the study dataset is composed of samples from 5 different study areas, spatial variations were not considered due to simplicity. Conclusions (cont’d) 22
This study is funded by the National Center for Freight and Infrastructure Research and Education (CFIRE) at University of Wisconsin, Madison. We thank TxDOT for providing the data and generous support to the subject matter. Acknowledgements 23