Download
1 / 1
10 likes | 116 Views
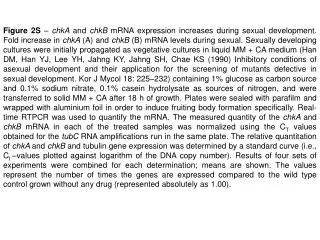
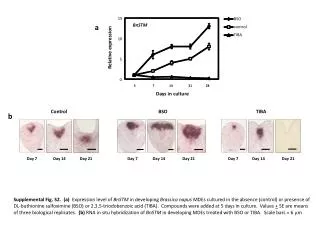
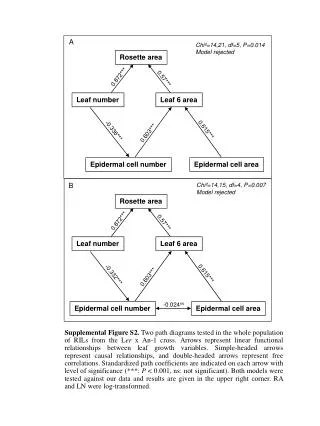
This study investigates the relationships between leaf growth variables in recombinant inbred lines (RILs) derived from the Ler x An-1 cross. Two path diagrams were constructed to examine linear functional relationships, with significant correlations indicated. Chi-squared tests revealed both models were statistically rejected, with notable findings such as the significant effects of rosette area and leaf number on leaf growth. Standardized path coefficients are presented alongside their significance levels. Supplemental Figure S2 provides a visual representation of the analyzed relationships.

E N D
A Chi²=14,21, df=5, P=0.014 Model rejected Rosette area 0.872*** 0.57*** Leaf number Leaf 6 area 0.615*** -0.336*** 0.603*** Epidermal cell number Epidermal cell area B Chi²=14,15, df=4, P=0.007 Model rejected Rosette area 0.872*** 0.57*** Leaf number Leaf 6 area 0.615*** -0.332*** 0.603*** -0.024ns Epidermal cell number Epidermal cell area Supplemental Figure S2. Two path diagrams tested in the whole population of RILs from the Ler x An-1 cross. Arrows represent linear functional relationships between leaf growth variables. Simple-headed arrows represent causal relationships, and double-headed arrows represent free correlations. Standardized path coefficients are indicated on each arrow with level of significance (***: P < 0.001, ns: not significant). Both models were tested against our data and results are given in the upper right corner. RA and LN were log-transformed.