Exponential Functions
Explore the fundamentals of exponential functions with a focus on their forms, including y = a(b)x, and their application in real-world scenarios such as investments and decay processes. Learn the concepts of exponential growth using examples like phone subscriber statistics, and exponential decay through insulin dosage models. This guide breaks down how to derive exponential equations and interpret their components, allowing for predictions about future values based on current data.

Exponential Functions
E N D
Presentation Transcript
Exponential Functions y = a(b)x Somebody find out how to make an avatar of me – that would be funny :o)
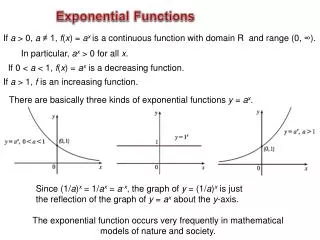
y = a(bx) a is the y-intercept b is the rate of change A linear function can have the form y = mx +b A quadratic function can have the form y = ax2 + bx + c What does an exponential function look like? There are 2 types of exponential functions – Exponential Growth and Exponential Decay Let’s look at an example of both and notice how the a and b affect the shape of the graph.
3 is the y-intercept 2 is the rate of change notice the 3,6,12,24,48… 4 is the y-intercept .75 is the rate of change Meaning the function is going down by 25%! Graph the equation y = 3(2x) Graph the equation y = 4(.75x)
So, if you want to write an exponential function All you need to know is the starting point and rate of change Let’s look at 2 situations – Representing the situation where a guy invests $5000 into an account that earns 5% interest every year We would have… y = 5000(1.05)x. Representing the situation where 10 grams of insulin injected into a diabetic’s body decays at 5% a minute We would have… y = 10(.95)x. The 5000 and 10 are hopefully very clearly the starting points and Thus the y-intercepts of the functions. We need to discuss the rates of change, 1.05 and .95
This 1st graph shows a rate of change of 1, the dependent variable is multiplied by 1 each time. This graph shows the data increasing by 5% This graph shows the data decreasing by 5% Notice that the 5% is either added to 1 or subtracted from 1 Depending on whether the data is increasing or decreasing.
In 1990 the number of cell phone subscribers was 5,283,000 in the US. By 2000 this number had risen to 109,478,000 Write an exponential equation to represent this situation and use it to estimate the number of cell phone subscribers in the year 2010. We know the starting value: 5,283,000 We need to find the rate of change. Use the equation y = a(b)x and the information we know to calculate the rate of change Divide by 5,283,000 first to get the exponential term by itself. 109,478,000 = 5,283,000(b)10 20.72 = b10 Take the 10th root or raise to the 1/10 power 20.721/10 = b so b= 1.35 y = 5,283,000(1.35)20 2,135,777,370 in 2010
In 1983, there were 102,000 farms in Minnesota, but by 1998, this number had dropped to 80,000. Write an exponential function to model the farm population of Minnesota and use that model to predict the number of farms in the year 2010 assuming the number continues to decline at the same rate. To use the equation y = a(b)x, we need to know the starting value, a, and the rate of change, b. We know a = 102,000, but we need to find b, just like before. 80,000 = 102,000(b)15 y = 102,000(.98)x .78 = b15 y = 102,000(.98)27 .78^(1/15) = b 59,115 farms .98 = b
Classwork and Homework Page 528: #19, 20, 27-32, 57-60, 62-66, 71-75* #75 will be on a quiz at some point
Page 528: #19, 20, 27-32, 57-60, 62-66, 71-75* #75 will be on a quiz at some point